Livepeer (LPT/USD) Bulls Signal the End of a Bearish Trend
Estimated Reading Time: 3 minutes
Don’t invest unless you’re prepared to lose all the money you invest. This is a high-risk investment and you are unlikely to be protected if something goes wrong. Take 2 minutes to learn more
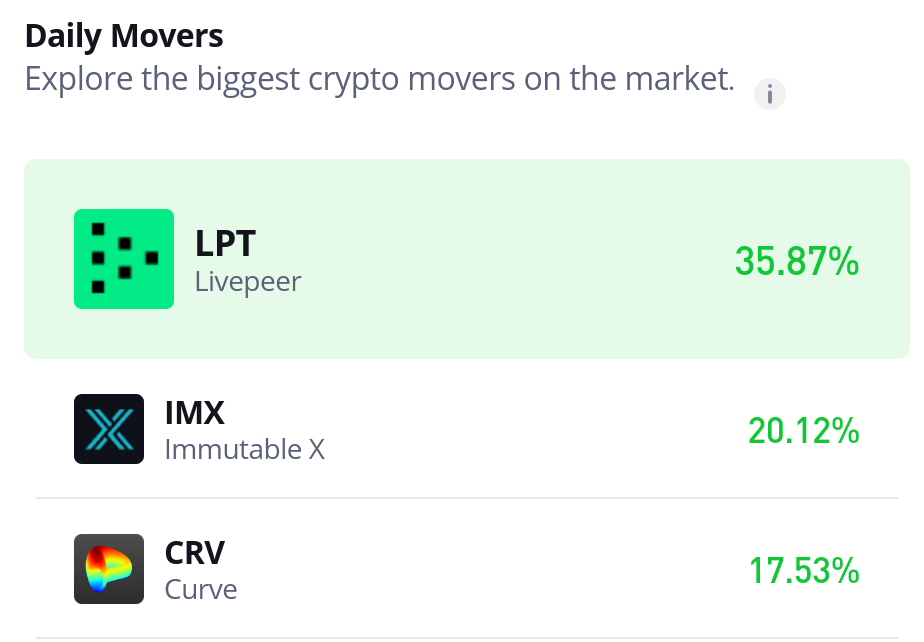
Livepeer (LPT/USD) is currently leading the list of daily movers, making waves in the crypto market with an impressive gain of approximately 38.9% today. This substantial surge suggests that the prolonged bearish trend may be coming to an end, as bullish momentum appears to be gaining dominance.
For quite some time, market sentiment had favored the bears, driving the price down significantly—from a peak around the $25 mark to a critical support level at approximately $3.50. However, today’s strong upward movement may indicate a potential reversal, with bulls reclaiming control and possibly setting the stage for a sustained recovery.
Livepeer Market Data
LPT/USD Price Now: $5.50
LPT/USD Market Cap: $220 million
LPT/USD Circulating Supply: 40 million LPT
LPT/USD Total Supply: 40 million LPT
LPT/USD CoinMarketCap Ranking: #175
Key Levels
- Resistance: $6.00, $6.50 and $7.00
- Support: $4.00, $3.50, and $3.00
Livepeer Technical Outlook: Bullish Liquidity Surge Challenges Bearish Dominance
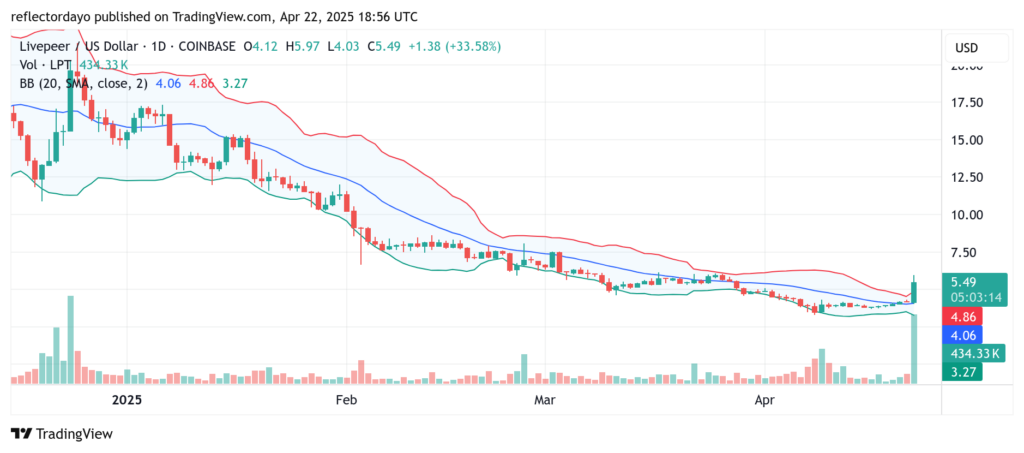
The bearish momentum in Livepeer began to weaken after the price broke below the $10.00 level in early February. Since then, the market has exhibited signs of deceleration, characterized by intermittent consolidation patterns that reflect the slowdown in downward pressure.
However, today’s market action marks a significant shift. There’s been an explosive surge in bullish liquidity, as evidenced by the unusually tall volume histogram accompanying the price movement. This crypto signal indicates heightened market participation and growing interest from buyers.
Despite this bullish momentum, price gains have been relatively modest—rising from $4.06 to around $5.50. This muted advance can be attributed to a clash of market sentiment, as increased demand meets resistance from profit-taking traders who have been holding positions from earlier levels.
Nonetheless, the bulls appear to have a slight advantage. The strong liquidity influx may signal the end of bearish dominance and market indecision. In the event of a short-term pullback or correction, the $5.00 level could serve as a new, higher support—potentially forming a solid base for continued upward movement.
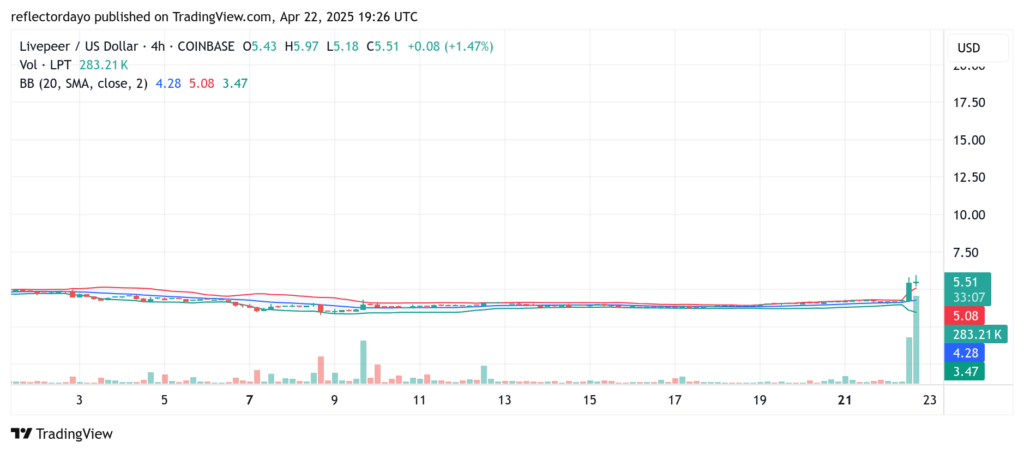
LPT/USD 4-Hour Chart Analysis: Bulls and Bears in a Standoff on the 4-Hour Chart
Analyzing the LPT/USD market from the 4-hour chart perspective provides deeper insight into current market behavior. In the ongoing trading session, a plus-sign Doji candlestick has emerged, accompanied by a tall volume histogram—taller than the previous one.
This pattern reflects a significant surge in trader activity and interest at the $5.50 price level. However, the presence of the Doji suggests indecision in the market, with neither buyers nor sellers able to gain clear control. This equilibrium has kept the price anchored at the $5.50 level for now.
The combination of strong volume and a Doji candlestick typically signals a standoff between bullish and bearish sentiment. As a result, a consolidation phase may be forming just above this level, potentially acting as a precursor to a breakout once the market determines its next direction.