Polygon (MATIC/USD) Market May Not Rapidly Increase Beyond $0.85
Estimated Reading Time: 3 minutes
Don’t invest unless you’re prepared to lose all the money you invest. This is a high-risk investment and you are unlikely to be protected if something goes wrong. Take 2 minutes to learn more
Polygon Price Prediction – January 8
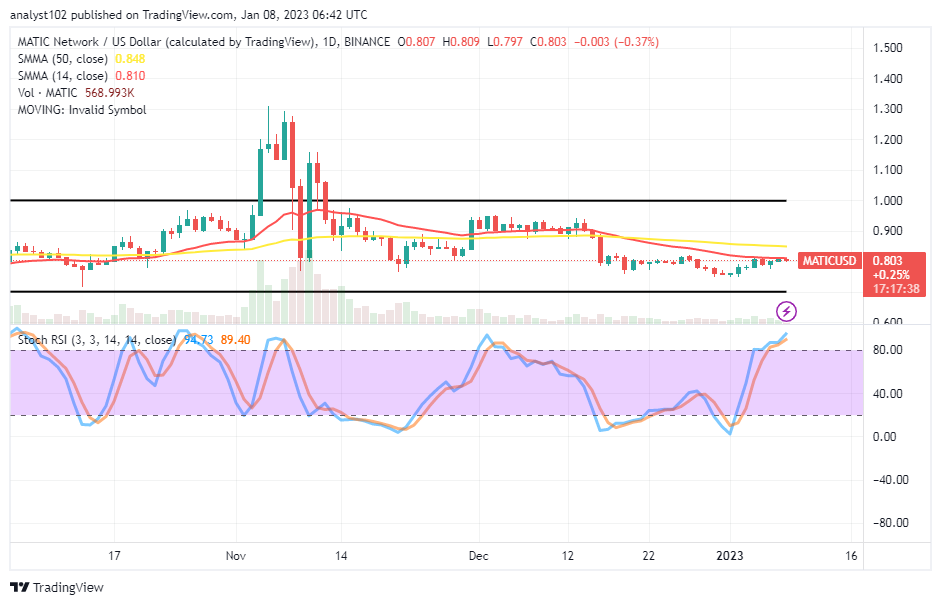
The MATIC/USD market trends may not rapidly increase beyond the $0.85 trading line in the near session as it is even close to the current trading spot of $0.803. The trading point has put to 0.37%, keeping between the high and the low values of $0.809 and $0.797.
MATIC/USD Market
Key Levels
Resistance levels: $0.85, $0.90, $0.95
Support levels: $0.70, $0.65, $0.60
MATIC/USD – Daily Chart
The MATIC/USD daily chart showcases the crypto-economic price trends may not rapidly increase beyond the $0.85 resistance level even though it is near. The 14-day SMA indicator is around the $0.810 value line underneath the $0.848 value of the 50-day SMA indicator. The range-bound areas are now maintaining a pattern that takes the shape of a declining perspective. The Stochastic Oscillators have penetrated the overbought region, faintly pointing toward the northbound direction at 89.40 and 94.73 levels.
Will the MATIC/USD market operation remain stable in the face of any downward motion?
It has been that the MATIC/USD price velocity to the north side is on the verge of reducing gradually as the market trends not to rapidly increase beyond the $0.85 resistance level even in the near time. A long-holding of the Stochastic Oscillators’ positions in the overbought arena will not be to back a line of sustainable ups in the long run. So, therefore, bulls are to suspend the re-launching of longing orders at this moment.
On the downside of the technical analysis, the emphasis is to derive from the reading of the Stochastic Oscillators marrying with the formation of a candlestick that is expectant will be a bearish type afterward to launch a longing order around the trend line of the 14-day SMA value. If a shorting order has to place at this moment, a stop loss order will have to be between $0.875 and $0.90 to protect any unheard-of increases in price.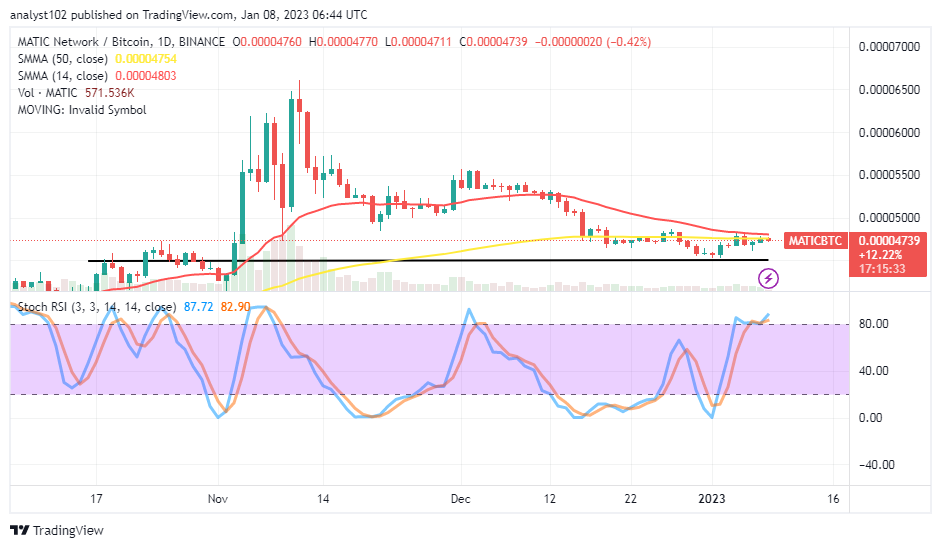
MATIC/BTC Price Analysis
In contrast, Polygon’s trending force against Bitcoin, as shown on the daily price analysis chart, may not rapidly increase beyond the B0000.5000 resistance that is not far over the trend lines of the SMAs. Variant trading tinier lower lows have been formed around the 50-day SMA indicator below the 14-day SMA indicator. The Stochastic Oscillators are in the overbought region, maintaining 82.90 and 87.72 levels. That signifies the base crypto will still likely go debasing, pairing with its counter-trading crypto to rebuild its baseline support line.
Note: Cryptosignals.org is not a financial advisor. Do your research before investing your funds in any financial asset or presented product or event. We are not responsible for your investing results.
You can purchase Lucky Block here. Buy LBLOCK