Wall Street Memes (WSM) Trade Hits Basis, Spirals Re-validated
Estimated Reading Time: 3 minutes
Don’t invest unless you’re prepared to lose all the money you invest. This is a high-risk investment and you are unlikely to be protected if something goes wrong. Take 2 minutes to learn more
Wall Street Memes Price Prediction – September 25
It appears that a series of smaller downward movements has occurred, linking the value of Wall Street Memes coin to the economic trends of the US currency, especially as trading is currently affected and prices are reaffirmed around $0.00005.
From a technical perspective of the WSM/USD market, prevailing sentiment reflects a measured buildup of optimism as participants assess the token’s capacity to withstand macroeconomic headwinds. Consolidation around present price zones may establish a potential launchpad for upward resumption, assuming structural market conditions sustain favorability and bullish forces reassert dominance over extended downside activity.
WSM/USD Market
Key Levels
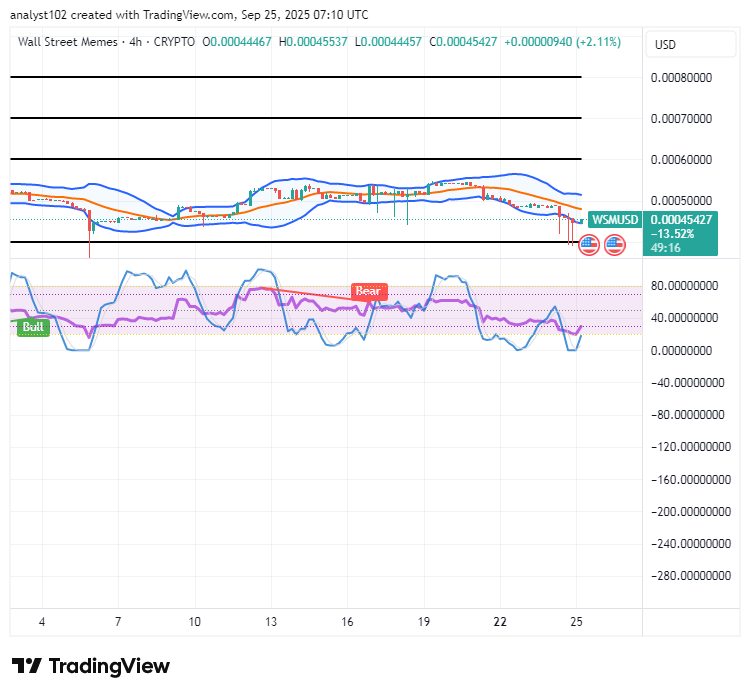
Resistance levels: $0.0006, $0.0007, $0.0008
Support levels: $0.0004, $0.0003, $0.0002
WSM/USD – 4-hour Chart
The WSM/USD medium-term chart reflects that the crypto-economic trade hit a basis, leading to spirals to get re-validated.
The Bollinger Bands remain compressed in the lower section, stretching alongside variant candlesticks that suggest a continuation of lower highs and lower lows, while underlying momentum signals subtle accumulation interest emerging. The Stochastic Oscillators are in the oversold region, indicating the likelihood of halting further declines soon.
Could the Crypto-Economic Trade’s Established Basis Trigger Cyclical Spiral Re-validation and Momentum?
The WSM/USD market has formed a base that may trigger cycle re-validation, since market consolidation often leads to fresh moves, supporting momentum shifts, drawing more traders, and strengthening stability within ongoing market conditions.
The WSM/USD trade has formed a base that may trigger cycle re-validation, since market consolidation often leads to fresh moves, supporting momentum shifts, drawing more traders, and strengthening stability within ongoing market conditions. Additionally, tighter Bollinger Bands and the Stochastic Oscillators suggest potential upward traction.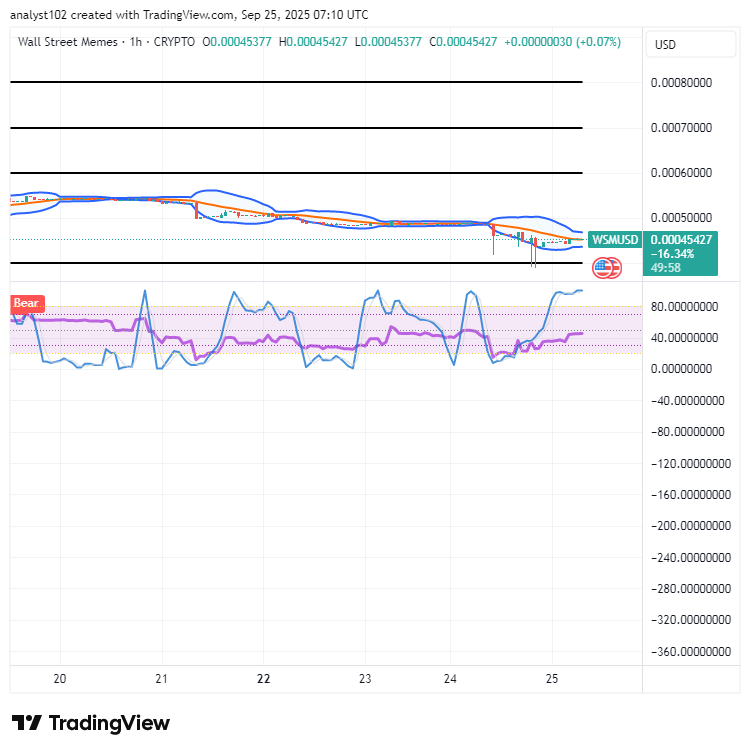
WSM/USD 1-hour chart
The 1-hour chart of the WSM/USD trade highlights crypto-economic activity establishing a firm basis, as cyclical price spirals undergo re-validation within prevailing market proceedings.
The 1-hour chart of the WSM/USD trade underscores ongoing crypto-economic dynamics, establishing a firmer structural basis as cyclical price spirals undergo technical re-validation within prevailing market proceedings, reinforcing prospective momentum shifts, and signaling heightened participant engagement across evolving trading conditions.
The $WSM community’s feedback has been acknowledged.
$WSM/$USDT is now officially available for trading on #Bybit Perpetual contracts.
$WSM community, we saw your Tweets! 👏$WSM / $USDT is now tradeable on #Bybit Perpetuals.
— Bybit (@Bybit_Official) October 13, 2023
Trade here: https://t.co/le4XyVyXaZ
Also want your project listed? Share your suggestions here:https://t.co/W7EWJVVNV5 https://t.co/XgXoL7g0rF