Compound (COMPUSD) Makes Its Third Touch on the Ascending Trend Line
Estimated Reading Time: 3 minutes
Don’t invest unless you’re prepared to lose all the money you invest. This is a high-risk investment and you are unlikely to be protected if something goes wrong. Take 2 minutes to learn more

Free Crypto Signals Channel
Compound Analysis – The Market Makes Its Third Touch on the Ascending Trend Line
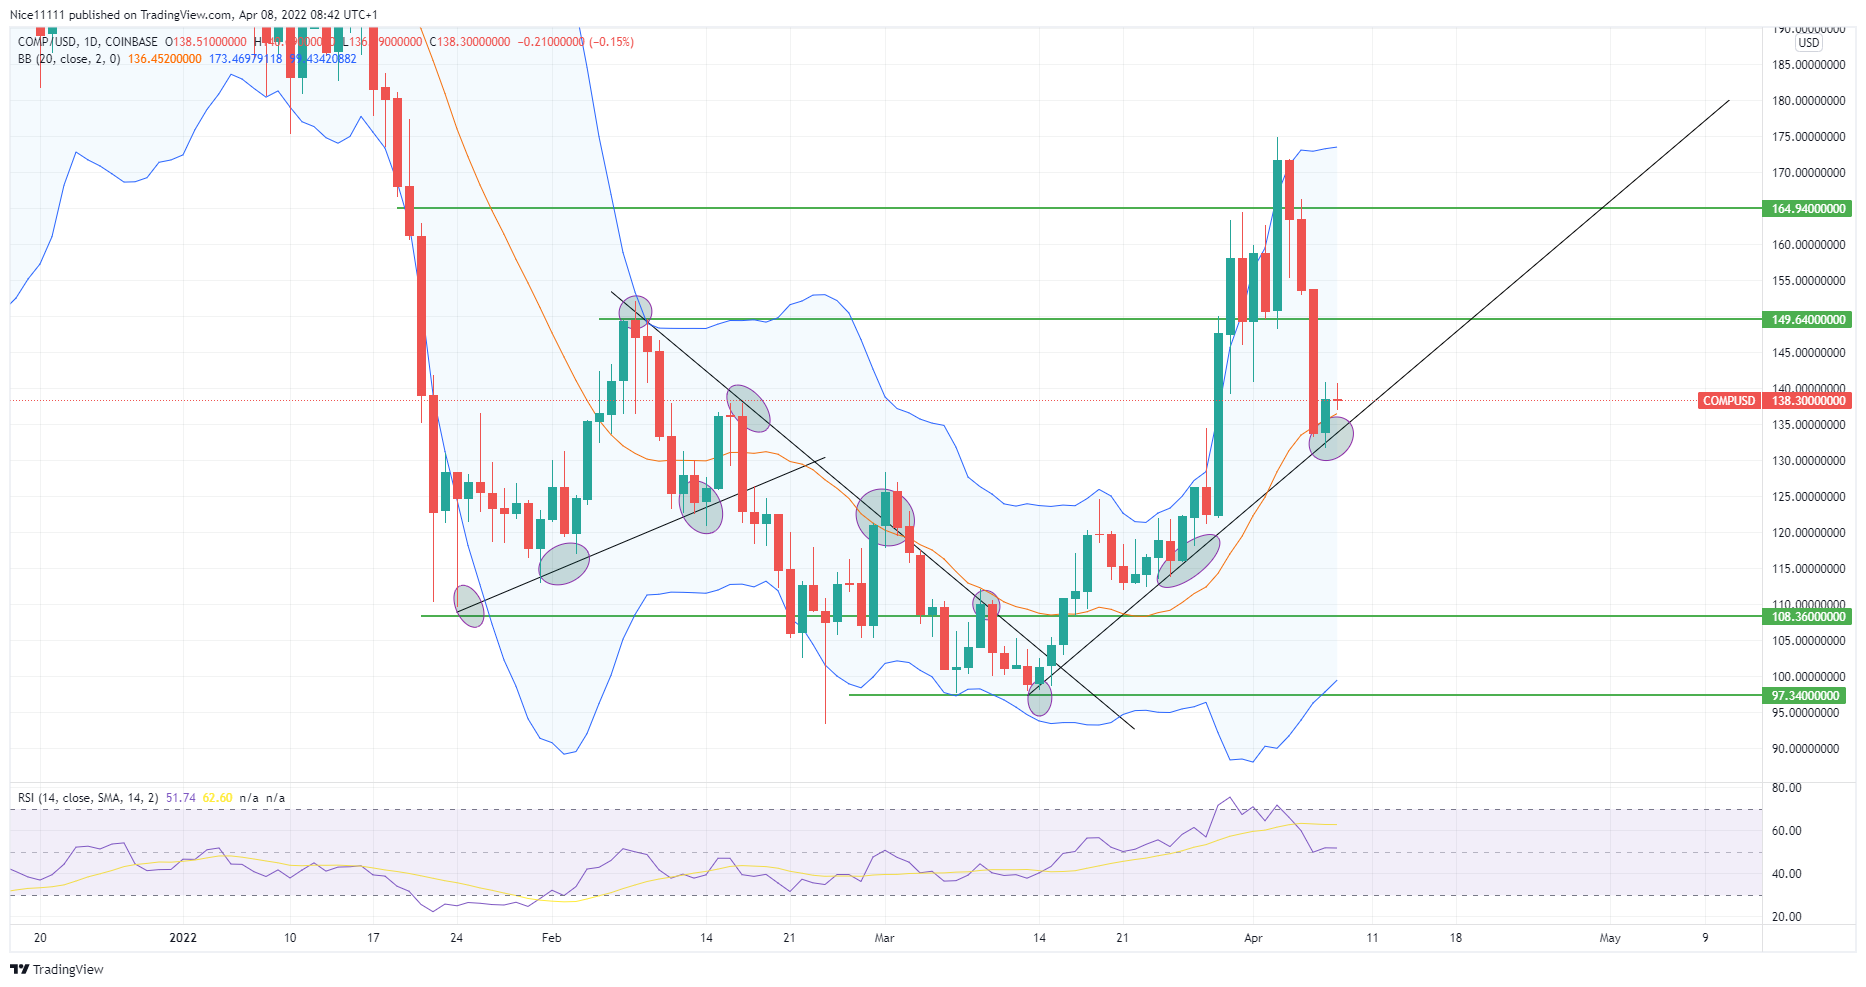
Compound makes its third touch on the ascending trend line after slipping to the $164.940 supply level. The market fell into a free fall to a demand zone of $108.360. Sharp rejections were spotted on the 22nd and 24th of January. The market bounced out of the zone. A retracement followed this to form the second touch of the building up trend line. The trend line helped the buyers to get in sync with the market. The price of Compound was pushed up to $149.640, where it met resistance.
Compound Major Zones
Supply Zones: 164.940, 149.640
Demand Zone: $108.360, $97.340
The market formed a swing high at the resistance zone of $149.640. This caused the price to crash, making its third touch on the ascending trend line. The market sprung from the trend line but failed to make a higher high. The lower high was formed on the 16th of February. A bearish engulfing candle followed immediately to reveal the bears were in control. The ascending trend line was broken.
The bears paused at the $108.360 demand zone once again. A retracement followed this to make its third touch on the new descending trend line. There was a fake-out formed on the first and second of March. The market slumped afterwards to the lower demand zone at $97.340. The previous high that led to the demand zone was swept away after the market took off from the demand zone. This was a clear sign of a new bullish run.

What to Expect From COMP/USD?
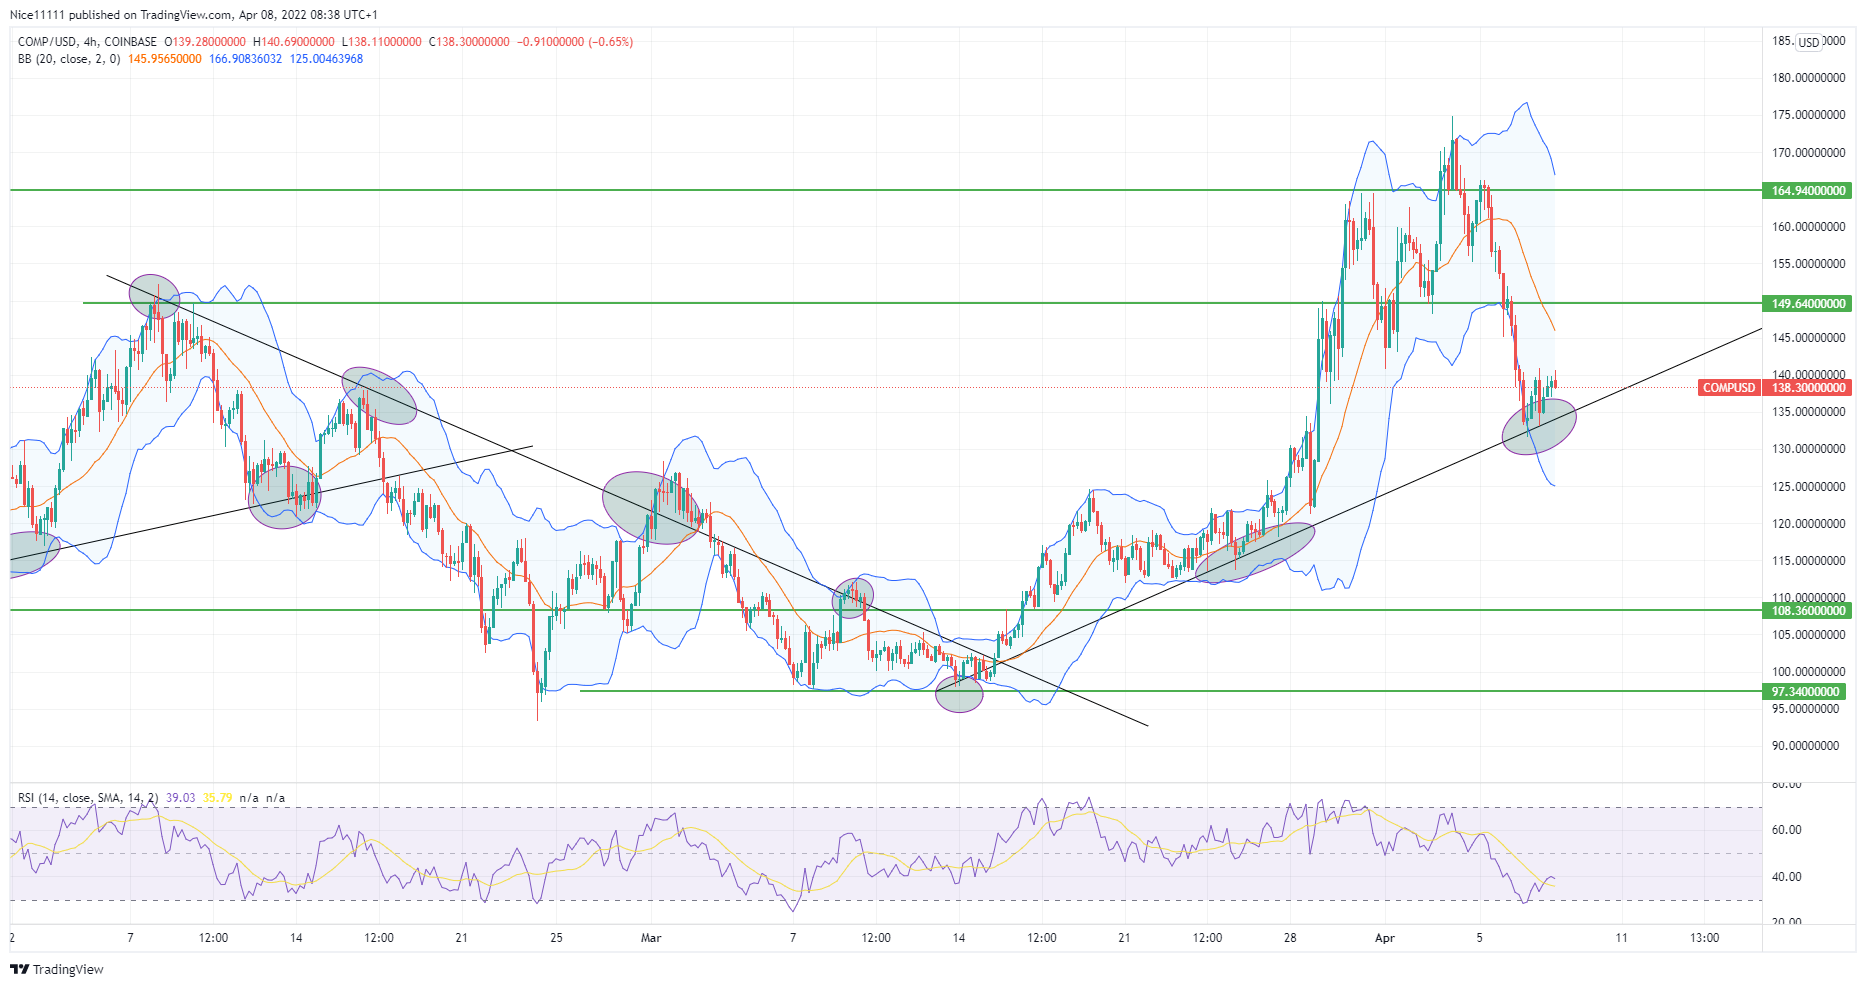
The market made its second touch on the ascending trend line on the 25th of March. The market rallied afterwards. Upon reaching the $165.940 supply zone, the market retraced to make its third touch on the ascending trend line. The market is still expected to rally further to pass the resistance level above $149.640. The market is just recovering from the oversold state on the Relative Strength Index on the four-hour chart. The lower Bollinger Band is also expected to support the price.
How To Buy Lucky Block
Note: Cryptosignals.org is not a financial advisor. Do your research before investing your funds in any financial asset or presented product or event. We are not responsible for your investing results.