Livepeer (LPT/USD): Strengthening Support Signals Bullish Momentum
Estimated Reading Time: 3 minutes
Don’t invest unless you’re prepared to lose all the money you invest. This is a high-risk investment and you are unlikely to be protected if something goes wrong. Take 2 minutes to learn more
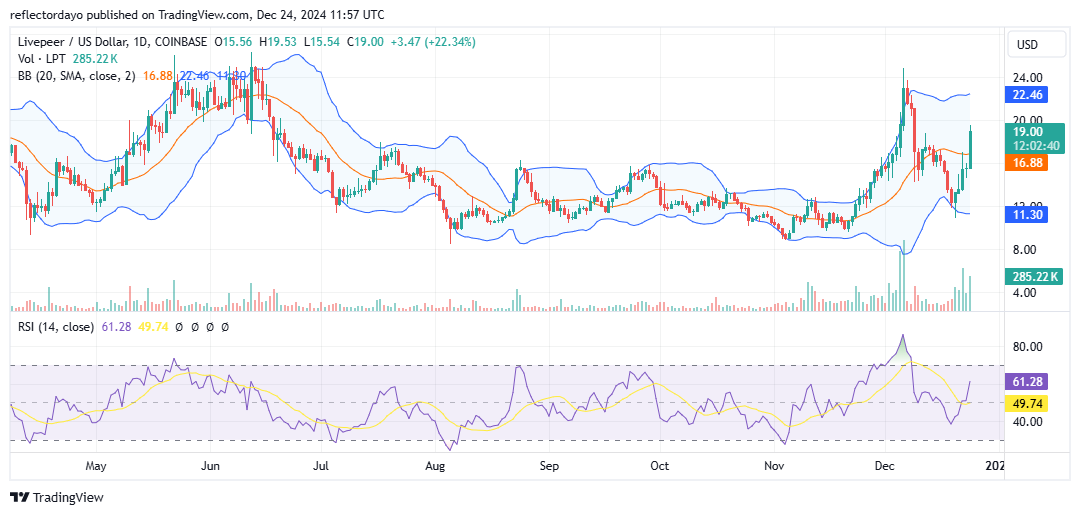
Livepeer (LPT/USD) demonstrated relative stability until mid-November, consistently trading near the $10.00 mark. However, on November 21, the market began to gain momentum, breaking several resistance levels as it climbed higher. A key resistance at $15.00 was easily surpassed, driven by strong bullish sentiment. The rally eventually peaked at an impressive $24.00, marking a significant milestone for the asset.
In early December, renewed bullish momentum fueled a spike in market volatility. This heightened volatility contributed to a notable bearish correction originating from the $24.00 high, highlighting the market’s dynamic nature.
Livepeer Market Data
- LPT/USD Price Now: $19.00
- LPT/USD Market Cap: $692 million
- LPT/USD Circulating Supply: 37 million LPT
- LPT/USD Total Supply: 37 million LPT
- LPT/USD CoinMarketCap Ranking: #131
Key Levels
- Resistance: $20.00, $22.00, and $24.00.
- Support: $15.00, $14.00, and $12.00.
Price Analysis for Livepeer: The Indicators’ Point of View
The increased Livepeer market volatility is evident in the expansion of the Bollinger Bands and the rapid movement of the RSI line in the Relative Strength Index. Despite the heightened volatility, the bulls have maintained their dominance by continuously pushing support levels higher.
Recently, the bull market successfully claimed the $15.00 price level, a critical resistance in previous trading sessions. This breakthrough highlights the strength and resilience of the bulls in the current crypto signal.
However, the ongoing volatility suggests that price action may remain somewhat erratic. While the bulls currently have the upper hand, the $15.00 level is expected to serve as a robust support if the market experiences a downturn. This bullish bias reinforces confidence in the market’s upward potential.
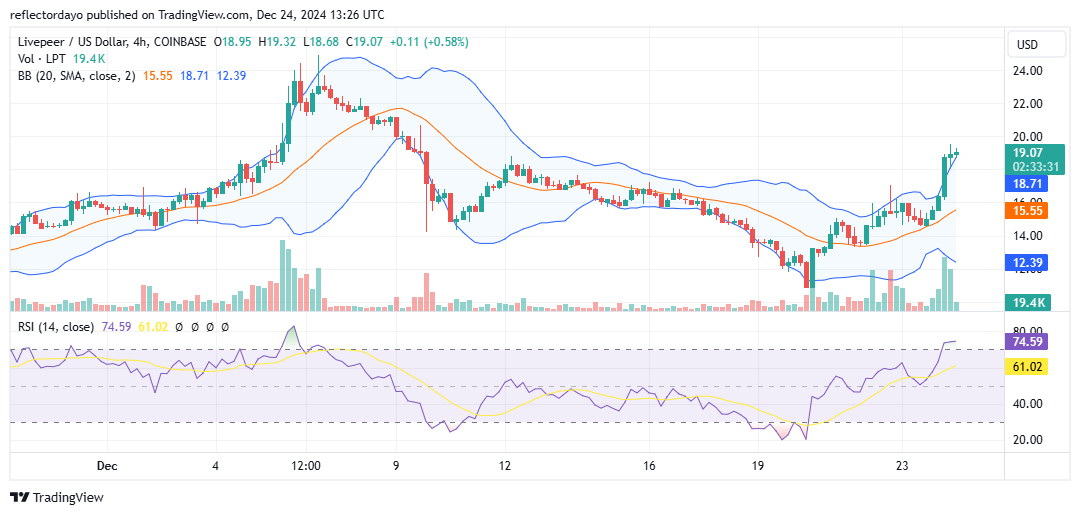
LPT/USD 4-Hour Chart Outlook
On a smaller timeframe, the heightened market volatility becomes more apparent, with bulls and bears appearing evenly matched as the market approaches the $20.00 price level. The recent 4-hour candlestick, characterized by a spinning top pattern, reflects indecision in the market.
Indicators further suggest that the market may be poised for a correction. Both the Bollinger Bands and the Relative Strength Index (RSI) signal overbought conditions, underscoring the possibility of a pullback. Additionally, the balance between buyers and sellers at the current price level has resulted in declining trading volumes, as evidenced by the shrinking histogram bars.
Two scenarios are likely: a consolidation near the $20.00 level or a corrective move back toward the $15.00 support level.