Synthetix (SNXUSD) Is Powerless To Resist as Sellers Plunge the Market
Estimated Reading Time: 2 minutes
Don’t invest unless you’re prepared to lose all the money you invest. This is a high-risk investment and you are unlikely to be protected if something goes wrong. Take 2 minutes to learn more

Free Crypto Signals Channel
Synthetix Analysis – SNXUSD Is Powerless To Resist the Pressure From Sellers
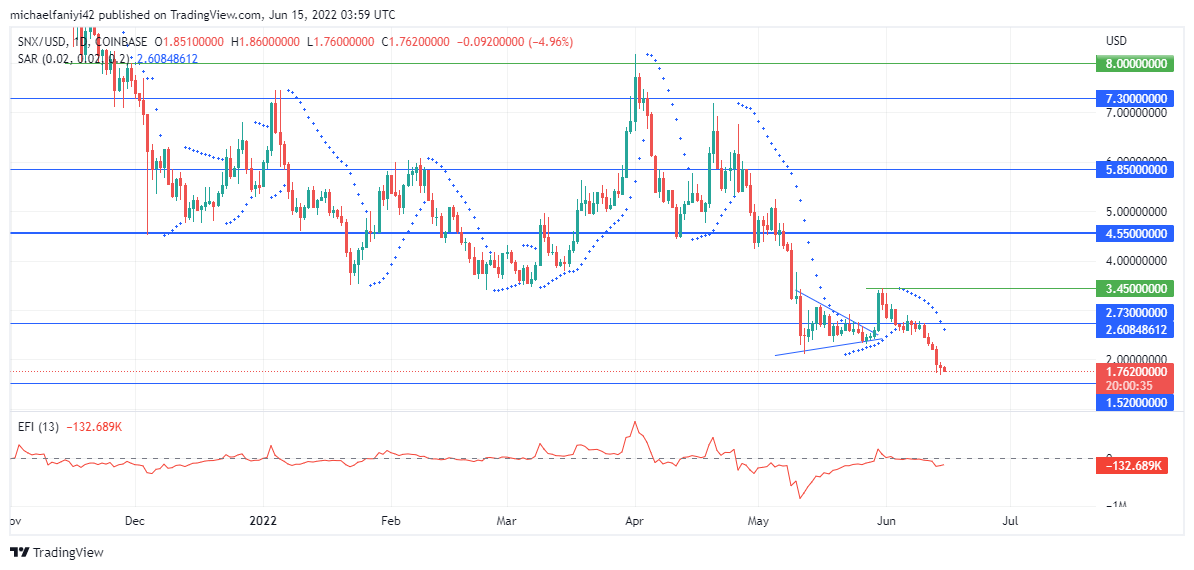
Synthetix is powerless to resist the pressure from sellers and has plunged to a two-year low. This is despite the best efforts of the buyers to lift the market. The price fluctuated at $2.730, such that it conformed into a symmetrical triangle. This led to an upward spike in the coin. However, the excitement was soon diminished as the market was beaten below the $3.450 key level.
Synthetix Critical Levels
Resistance Levels: $3.450, $4.550
Support Levels: $1.520, $2.730
Despite the bulls’ efforts, the bears have dominated the market since 2021. It can be seen that the market is consistently dropping in a step-wise fashion. However, the $4.550 critical level acted as a significant support level to keep the price up for a period ranging from December last year to May this year. Per bearish dominance, the market has been driven lower from the level.
Therefore, the price drops to $2.730. The market begins to fluctuate at this level as the buyers oppose the downward flow of the market. A triangle pattern was then used to spike the market. However, that was all there was to it, as the coin failed to bypass $3.450. Synthetix embarks on a swift descent that has broken through $2.730 and is still falling. The Elders Force Index highlights the present dominance of the bears with a dip of the force line below zero.

Market Expectations
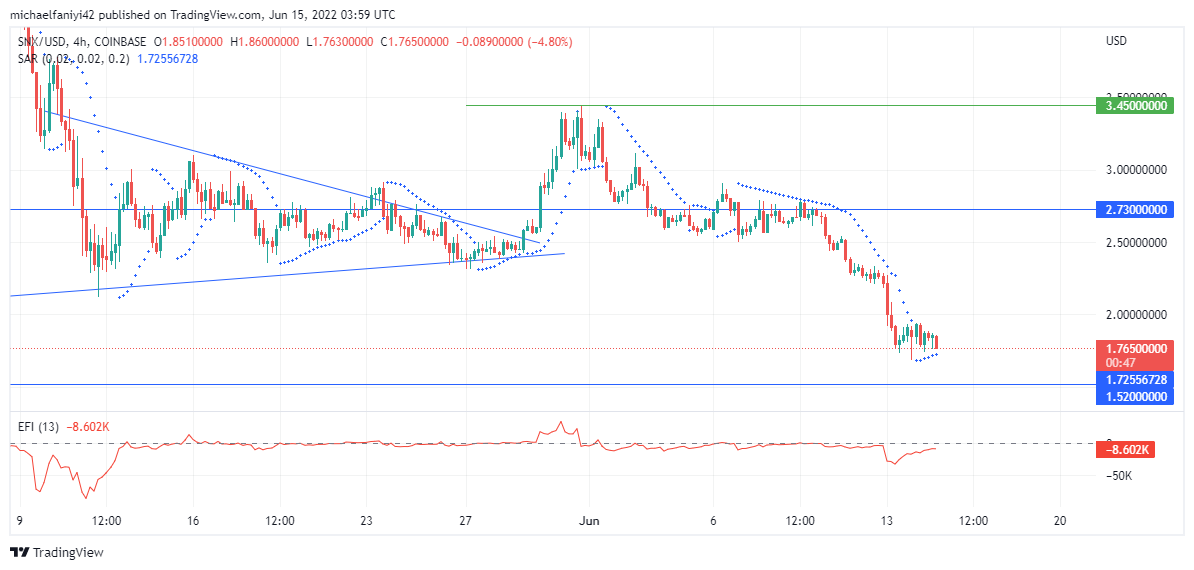
The 4-hour chart shows that the $2.730 price level tried to defend the market, but it ultimately fell short. The reason is that momentum was already with the bears as the force line of the EFI was already below the zero level. Also, on the daily and 4-hour charts, the Parabolic SAR (Stop and Reverse) has stationed its dots above the candlesticks to show a definite downward direction. The coin is due to drop to $1.520.
How To Buy Lucky Block
Note: Cryptosignals.org is not a financial advisor. Do your research before investing your funds in any financial asset or presented product or event. We are not responsible for your investing results.