Solana (SOL/USD) Maintains Bullish Momentum with Traders Still Willing to Buy $100
Estimated Reading Time: 3 minutes
Don’t invest unless you’re prepared to lose all the money you invest. This is a high-risk investment and you are unlikely to be protected if something goes wrong. Take 2 minutes to learn more
The Solana market has exhibited strong performance, surging past the $120 mark before experiencing a retracement. However, the bullish momentum has started to wane as the market nears the $100 price point. This suggests that a significant number of traders maintain a bearish sentiment at this price level. While the recent market movement has attracted traders to both the bullish and bearish sides, it has concurrently heightened the overall volatility.
Solana Market Data
- SOL/USD Price Now: $105.4
- SOL/USD Market Cap: $44,971,630,060
- SOL/USD Circulating Supply: 428,712,435 SOL
- SOL/USD Total Supply: 565,885,348 SOL
- SOL/USD CoinMarketCap Ranking: #5
Key Levels
- Resistance: $115, $120, and $125.
- Support: $92, $85, and $80.
Solana Market Forecast: Analyzing the Indicators
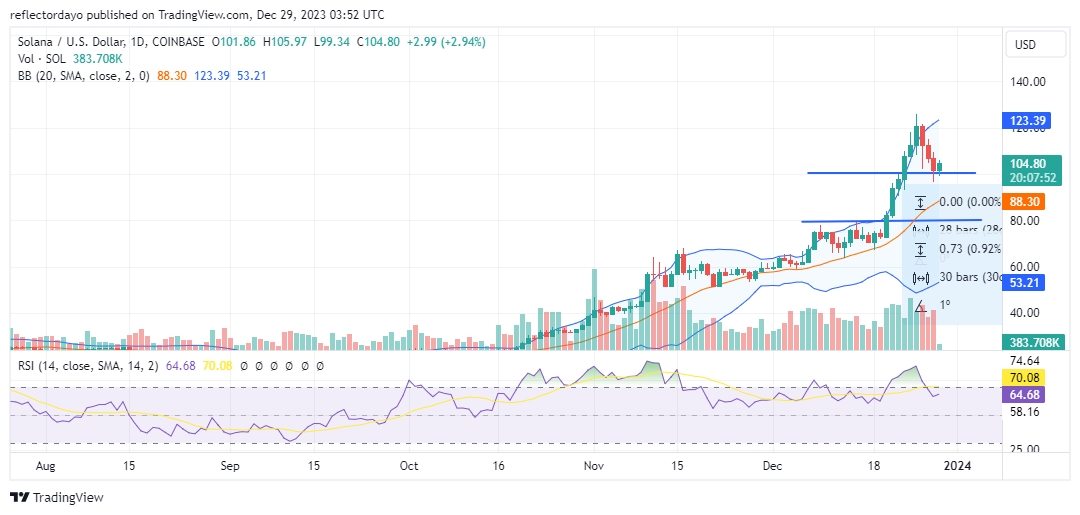
Initially, the $100 price level served as a prominent resistance, keeping the market range-bound for some time. However, on December 21, bullish momentum propelled the market beyond this threshold. This shift catalyzed a surge in bullish sentiment, prompting previously hesitant traders to enter the market, leading to a substantial price increase. Subsequently, after encountering significant resistance around the $120 mark, the price has seen a pronounced retracement.
Given the aggressive nature of the preceding bullish trend, such a pullback was anticipated. Nonetheless, the establishment of a new support level around $100 indicates continued bullish activity. Should bearish sentiment persist, the prevailing bullish bias might result in a period of consolidation before the market determines its next definitive direction. However, given the disparity between current price movements and trading volume, there is a possibility that bearish momentum is strengthening.
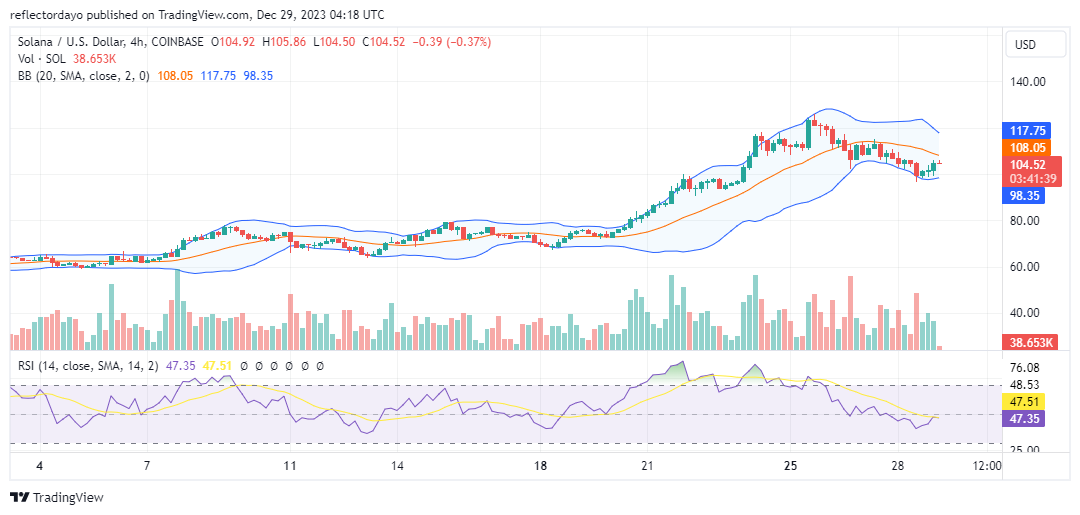
SOL/USD 4-Hour Chart Outlook
When closely examining the Solana market, a divergence becomes evident between the price action and the Relative Strength Index (RSI) line as the market approaches the $100 price threshold. Despite the Solana market achieving higher highs, the RSI line registers lower highs, indicating weakening bullish momentum. This discrepancy helps explain the pronounced price retracement observed. Nevertheless, given the prevailing bullish sentiment, a support level has established around the $100 mark, potentially facilitating a market rebound. However, should bearish sentiment intensify, we might witness a period of price consolidation.