Litecoin (LTC) Price Prediction: LTC/USDT Bulls Get Bounced
Estimated Reading Time: 3 minutes
Don’t invest unless you’re prepared to lose all the money you invest. This is a high-risk investment and you are unlikely to be protected if something goes wrong. Take 2 minutes to learn more

Litecoin (LTC) Price Prediction: April 21, 2025
The Litecoin market has seen a consistent upward retracement for five straight sessions. While the upside movement has been modest, the ongoing session has been more volatile in both directions. Let’s further analyze this market in more detail below.
LTC/USDT Long-Term Trend: Bullish (Daily Chart)
Key Price Levels:
Resistance: $80.00, $85.00, $90.00
Support: $75.00, $70.00, $65.00
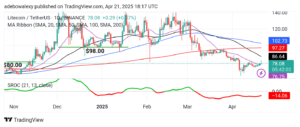
The Litecoin market has steadily moved past the 20-day Moving Average (MA) line. The latest price candle on the chart is positioned above the 20-day MA curve. However, this same candle features a long upper shadow due to headwinds experienced during the session. Simultaneously, despite the recent downward contraction, the Stochastic Rate of Change (SROC) indicator line maintains a slightly upward trajectory below the equilibrium level.
Litecoin (LTC) Price Prediction: LTC/USDT Market Retains a Key Position
Although we previously noted that Litecoin has seen steady upward retracement, it’s also evident that downward forces are active. The latest price candle on this chart displays a long upper shadow, indicating significant bearish pressure on the daily chart.
Nevertheless, this token continues to trade above the 20-day MA curve at the time of writing. Furthermore, the trajectory of the SROC indicator lines remains slightly upward, even below the equilibrium level. Technically, this suggests that the market may still experience further upward retracement.
Litecoin (LTC) Price Prediction: LTC/USDT Downward Retracement Is Gaining Momentum
Although price action in the Litecoin 4-hour market remains above important technical levels, it’s clear the market has experienced a noticeable pullback. The most recent price candles show that prices have been declining for the past two sessions. This decline was milder in the previous session, but momentum appears to have strengthened in the ongoing one.
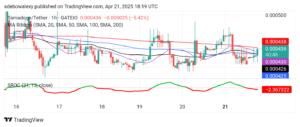
However, price action remains above all MA lines. Likewise, the SROC indicator lines maintain a generally upward trajectory above the equilibrium level. Technically, the emerging indications suggest that price action may still rebound upward. This is likely because the price remains above most of the MA curves, and the SROC indicator line is still positioned above the equilibrium level. Therefore, traders can maintain a bullish outlook toward the $82.00 price level.