Dogecoin (DOGE) Price Prediction: DOGE/USDT Market Sees a Spark
Estimated Reading Time: 2 minutes
Don’t invest unless you’re prepared to lose all the money you invest. This is a high-risk investment and you are unlikely to be protected if something goes wrong. Take 2 minutes to learn more
Dogecoin (DOGE) Price Prediction: April 21, 2025
The Dogecoin market has been quite bearish for a while now, as its price action continues to decline, dropping from one support level to another. However, with Bitcoin gradually recovering, Dogecoin also appears to be following suit.
DOGE/USDT Long-Term Trend: Bullish (Daily Chart)
Key Price Levels:
Resistance: $0.1800, $0.2000, $0.2200
Support: $0.1600, $0.1400, $0.1200
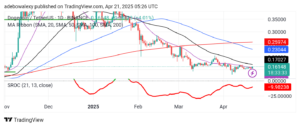
The ongoing session in the Dogecoin daily market has been positive. The latest price candle on the daily chart is a green one and has placed the market above a key technical indicator—the 20-day Moving Average (MA) line. Similarly, the Stochastic Rate of Change (SROC) lines are still below the 0.00 mark but are trending upward toward the equilibrium level of the SROC indicator.
Dogecoin (DOGE) Price Prediction: DOGE/USDT Shows Minimal Positivity
The fact that Dogecoin’s price action is beginning to rise back above critical technical levels is a mildly positive sign. The recent green candle has brought the market above the 20-day MA line.
However, price activity has yet to establish solid support above this level, as it has only slightly pierced through the mentioned technical line. Still, the SROC indicator is sloping upward, suggesting bullish momentum. This aligns with the current trend and supports the possibility of continued upward movement.
Dogecoin (DOGE) Price Prediction: DOGE/USDT Possesses a Promising Outlook
The Dogecoin market shows even more promising signs on the 4-hour chart. Price action has moved above the 20-, 50-, and 100-day MA lines. Additionally, all three MA lines are converging below the current price, with the 20- and 100-day lines nearing a bullish crossover.
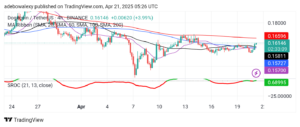
The latest candle also appears to have established support above the $0.1600 level. The SROC lines have resurfaced above the equilibrium point and are now green, indicating growing bullish momentum. Therefore, it’s likely that the market could gain further ground—potentially reaching $0.1700 and possibly extending toward $0.2000.