Polygon (MATIC/USD) Market Elongates in a Fluctuation Session
Estimated Reading Time: 3 minutes
Don’t invest unless you’re prepared to lose all the money you invest. This is a high-risk investment and you are unlikely to be protected if something goes wrong. Take 2 minutes to learn more
Polygon Price Prediction – May 7
The MATIC/USD price has witnessed several indecisions between the two market movers as the crypto-economic market elongates in a fluctuation session around the $1 line. The last several hours have had a high and a low-value line of $0.987 and $0.970, keeping a minute positive percentage rate of 0.31. Despite the case, indications still show buyers may not survive attempts to push northward, weighing the current forces.
MATIC/USD Market
Key Levels
Resistance levels: $1.10, $1.15, $1.20
Support levels: $0.90, $0.80, $0.70
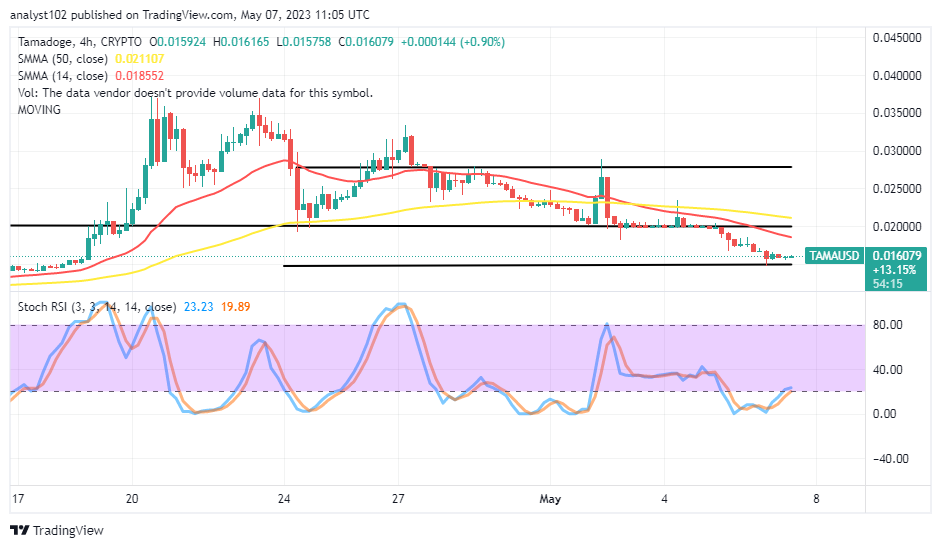
MATIC/USD – Daily Chart
It showcases on the MATIC/USD daily chart t that the crypto-economic market elongates in a fluctuation session that has caused a line of ranges around $1 over time. The 14-day SMA indicator is at $1.030, underneath the $1.075 line of the 50-day SMA indicator. The Stochastic Oscillators have sprung northbound from the oversold region to position around the 80. And they are making efforts to close their lines around the level. It means the market may see a pit-stop trading moment in the following cycle for a while.
What is the ideal trading strategy for the MATIC/USD near the $1 market?
It is still in focus that the MATIC/USD market buyers have not been able to compound elements of forces to surge more highs sustainably above $1 as it has been that the crypto market is elongating in a fluctuation session. The Stochastic Oscillators will continue to play an important role in determining any potential direction the price tends to move in.Based on that, buyers are to wait for a lower providence index that the indicator will return after a while.
On the devaluation-moving direction of the MATIC/USD trade technical analysis, looking at the overall positioning of the indicators as a whole currently, the potencies remain that sellers stand the pace of pressing the price down from or around the SMA trend lines. Short-position takers have to maintain retarding force against any consolidation-moving probability that could surface in the long run. Instant short position executors should back their entry order with a price action to achieve a quick note of their decisions.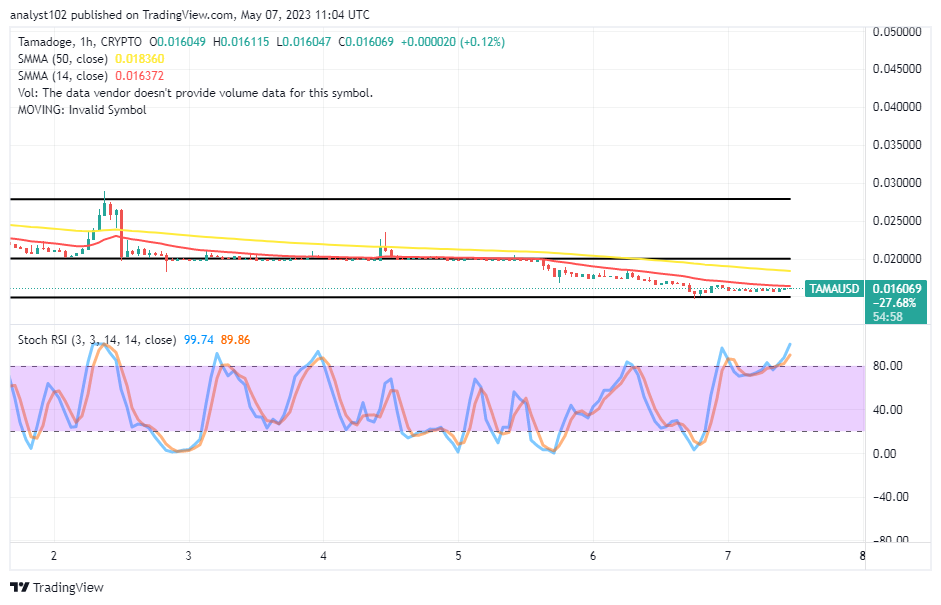
MATIC/BTC Price Analysis
In contrast, Polygon, after a long line of declines against the trending ability of Bitcoin, has resorted relatively to a fluctuation session around the horizontal line drawn below the SMA trend lines. The 14-day SMA indicator is underneath the 50-day SMA indicator. The Stochastic Oscillators are around 72.35 and 67.32 levels to denote the base crypto is still under a threat of risking more decreases against the counter-trading crypto. When making decisions, traders had to abide by the Oscillators’ level of reading performance.
Note: Cryptosignals.org is not a financial advisor. Do your research before investing your funds in any financial asset or presented product or event. We are not responsible for your investing results.
You can purchase Lucky Block here. Buy LBLOCK