Bitcoin (BTC/USD) Market Experiences Significant Increase
Estimated Reading Time: 3 minutes
Don’t invest unless you’re prepared to lose all the money you invest. This is a high-risk investment and you are unlikely to be protected if something goes wrong. Take 2 minutes to learn more
Bitcoin Price Prediction – August 8
The most valuable crypto market experiences a significant increase in its worth, having to surge past recent resistance at $40,000. The BTC/USD’s price now trades around a higher level of $44,964 at a negative percentage rate of about 0.48 as of writing.
BTC/USD Market
Key Levels:
Resistance levels: $47,500, $50,000, $52,500
Support levels: $40,000, $37,500, $35,000
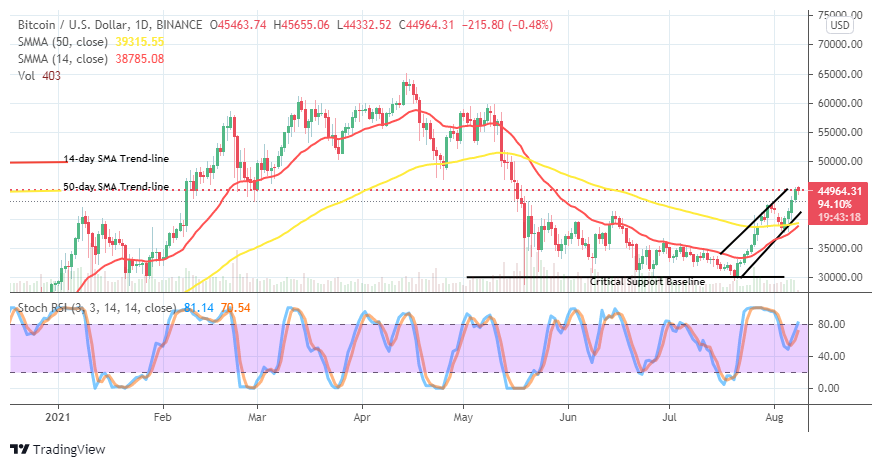
BTC/USD – Daily Chart
There has been on the BTC/USD daily chart that the crypto market experiences a significant increase following variant a bullish candlestick that formed during the August 4th trading session. The candlestick slightly moved against the long-resisting trading line at $40,000. From there, the crypto has been in an increasingly moving manner that also goes with slow and steady orderliness. The smaller-lengthy bullish channels drew to possibly master the path of the crypto’s journey to the moon as the 14-day SMA trend-line bends northward, touching the 50-day SMA trend-line from beneath. The Stochastic Oscillators had initially moved down into the ranges of 80 and 40. They now cross the lines northbound to the higher range-line. That indicates that the pressure to the north is still on a higher note.
Has uptrend price movement fully returned as the crypto market currently experiences a significant increase?
The BTC/USD trade operation hasn’t been that far from a support-building situation even as the crypto market experiences a significant increase in its valuation. The reason for that is that the crypto had once appreciated to around the tune of $65,000. It hoped that bulls would now have to be making the best use of notable downs coupled with active rebounding motion to launch a buy position. Like wisely, investors can as well play along before more aggressive moves unveil at later sessions.
Regarding the downside analysis, a resistance trading zone needed to take a form, giving a kind of sideways movement. A sudden powerful reversal at an upper side will most likely give the market bears a better chance to spot a sell entry. As the level at $45,000 has freshly traded around, variant activities involving ups and downs are bound to occur.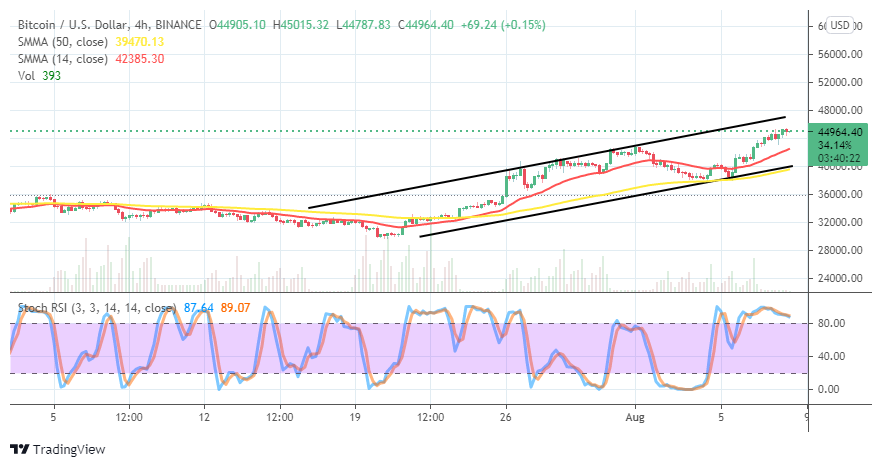
BTC/USD 4-hour Chart
It also shows on the BTC/USD medium-term chart that the crypto market experiences a significant increase. There is a featuring of bullish channel trend lines on the chart. The 14-day SMA indicator is above the 50-day SMA indicator. The lower bullish channel trend-line drew, alongside the bigger SMA, pointing toward the north. The Stochastic Oscillators are in the overbought region with their lines conjoined to consolidate in it. That indicates that the most valuable crypto can maintain its stance in the trading operations by holding firmly especially, a bit above the zone at $40,000. An eventual forceful push past of $45,000 to the north will most likely extend to a higher value of around $47,500.
Note: Cryptosignals.org is not a financial advisor. Do your research before investing your funds in any financial asset or presented product or event. We are not responsible for your investing results.
You can purchase crypto coins here. Buy Tokens