Uniswap (UNI) Price Prediction: UNI/USDT Bears Take a Pause
Estimated Reading Time: 2 minutes
Don’t invest unless you’re prepared to lose all the money you invest. This is a high-risk investment and you are unlikely to be protected if something goes wrong. Take 2 minutes to learn more

Uniswap (UNI) Price Prediction: March 13
The Uniswap market has been retracing to lower prices ever since price action tested the $19.00 price level. Currently, price action has been consolidating just below the $6.00 price mark. Besides this, price action seems to have assumed a subdued look.
UNI/USDT Long-Term Trend: Bearish (Daily Chart)
Key Price Levels
Resistance: $6.00, $7.00, $8.00
Support: $5.00, $4.00, $3.00
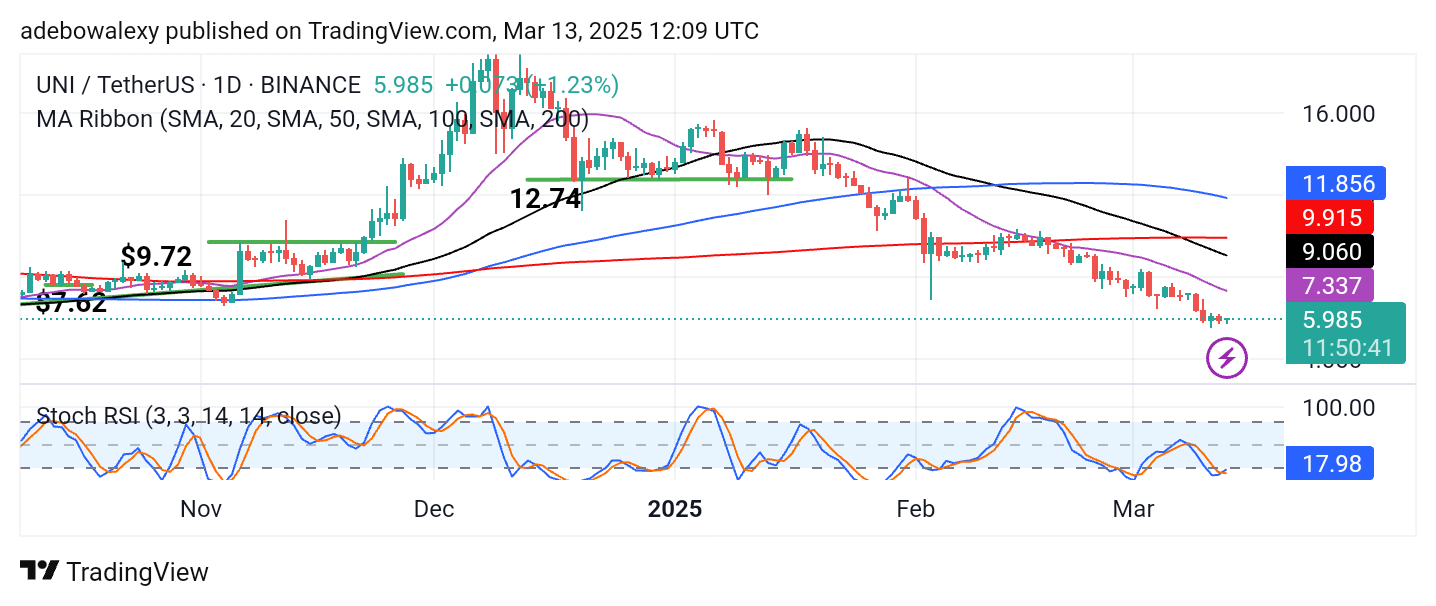
Over the past two sessions, there has been reduced activity in the Uniswap market. Consequently, price action can be seen consolidating below all the Moving Average (MA) lines. The last price candle here appears green but is small in size. As a result, the crossover on the Stochastic Relative Strength Index (RSI) lines can be seen proceeding sideways in the oversold region of the indicator at the moment.
Uniswap (UNI) Price Prediction: UNI/USDT May Exit Consolidation Soon
In the Uniswap daily chart, one can see that price action has been retracing to lower price levels. Generally, price action has been falling from one temporary support level to another. Another such stop has been reached once more.
Considering the position of recent price candles, it seems likely that the market may still proceed downward. However, the Stochastic RSI lines have delivered a crossover in the oversold region, but the resulting lines of the indicator are still projected sideways since the crossover has just occurred. Nevertheless, price activity here seems quite subdued.
Uniswap (UNI) Price Prediction: UNI/USDT Market Stays Projected Downward (4-Hour Chart)
On the 4-hour market, we can see that price action has rebounded downward off the resistance formed by the 20-day MA lines. This tentatively keeps the market subdued and projected toward lower price levels. The last price candle is small but appears after price action tested the 20-day MA lines.
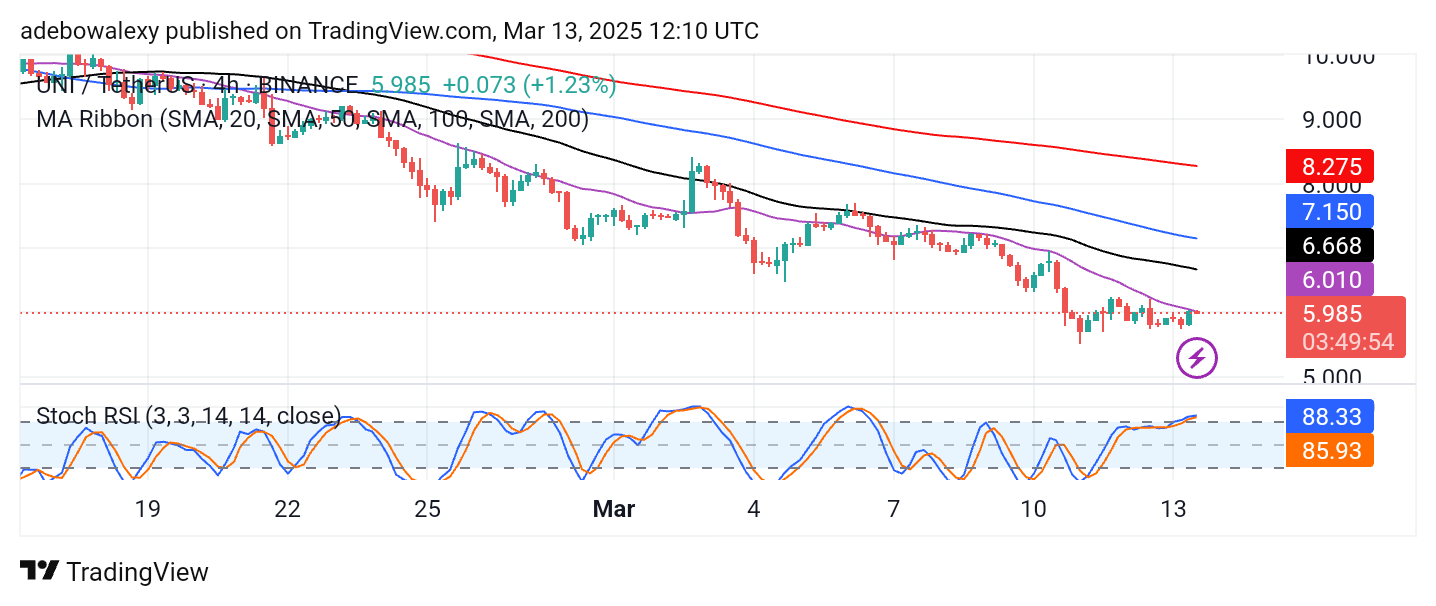
The Stochastic RSI lines are still in the overbought region and above the 80 mark of the indicator. This implies that the technical indicators are still not registering the minimal downward rebound. Nevertheless, traders can eye a test of the $5.00 price level.