Bitcoin (BTC) Price Prediction: BTC/USDT Struggles Below $85,000 Threshold
Estimated Reading Time: 3 minutes
Don’t invest unless you’re prepared to lose all the money you invest. This is a high-risk investment and you are unlikely to be protected if something goes wrong. Take 2 minutes to learn more

Bitcoin (BTC) Price Prediction – March 12
The Bitcoin market has experienced significant price declines in recent sessions. One such instance occurred when the market dipped below the $80,000 and $79,000 price levels. Additionally, the ongoing session suggests that price activity may have encountered resistance earlier than anticipated.
BTC/USDT Long-Term Trend: Bearish (Daily Chart)
Key Price Levels
Resistance: $90,000, $100,000, $110,000
Support: $80,000, $70,000, $60,000
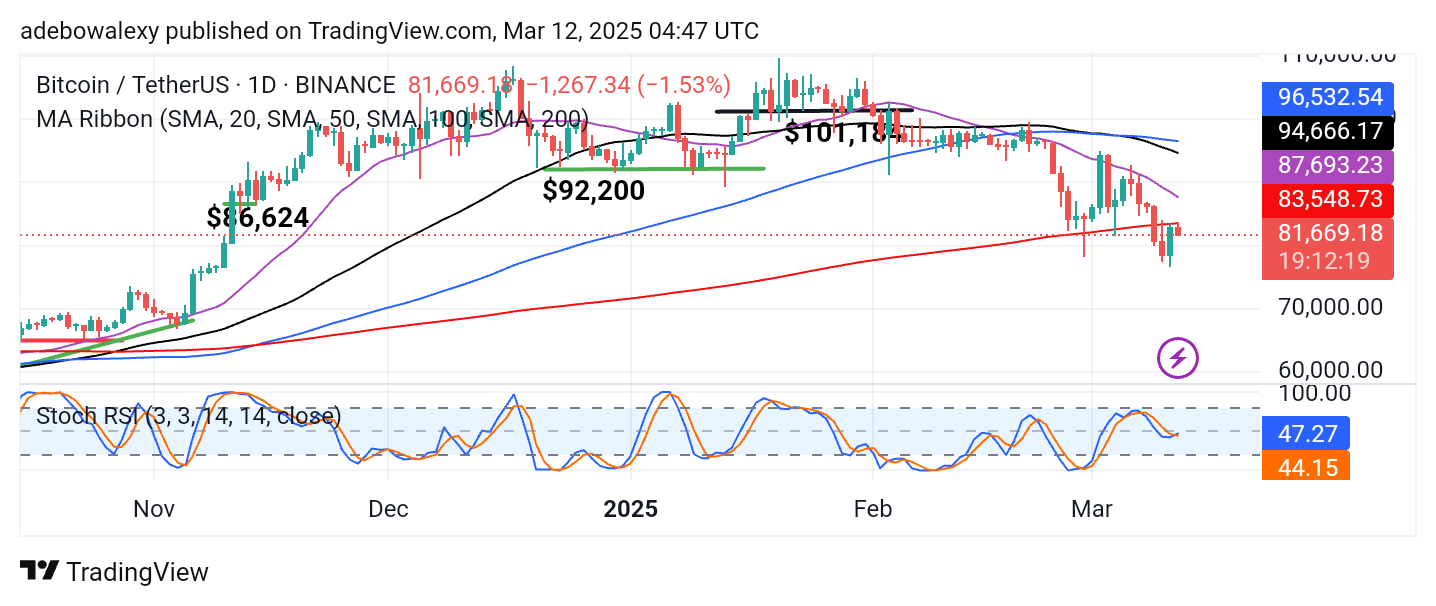
Bitcoin has been trending lower, with price action forming consecutive lows. In the current session, the market has rebounded off the 200-day Moving Average (MA) line. As a result, the most recent price candles remain below all MA lines on the chart. However, the Stochastic Relative Strength Index (RSI) lines continue to show an upward crossover, though they are moving sideways.
Bitcoin (BTC) Price Prediction: Will the BTC/USDT Downtrend Continue?
Price action in the Bitcoin daily market suggests that BTC remains in a downtrend. However, the price has largely held above the $80,000 level. The current session shows a downward retracement after bouncing off the 200-day MA line.
Meanwhile, the Stochastic RSI has recently delivered an upward crossover, primarily due to the bullish retracement observed in the previous session. The indicator’s lines remain sideways for now, as the crossover is still developing and the last session’s gains outweigh the ongoing session’s decline. Traders may need to remain on the sidelines for better market clarity.
Bitcoin (BTC) Price Prediction: BTC/USDT Extends Its Downward Retracement (4-Hour Chart)
On the Bitcoin 4-hour chart, price action has continued downward for the third consecutive session. Similar to the daily chart, this downward retracement has occurred after bouncing off the 200-day MA line. However, price action is now closely hugging this moving average.
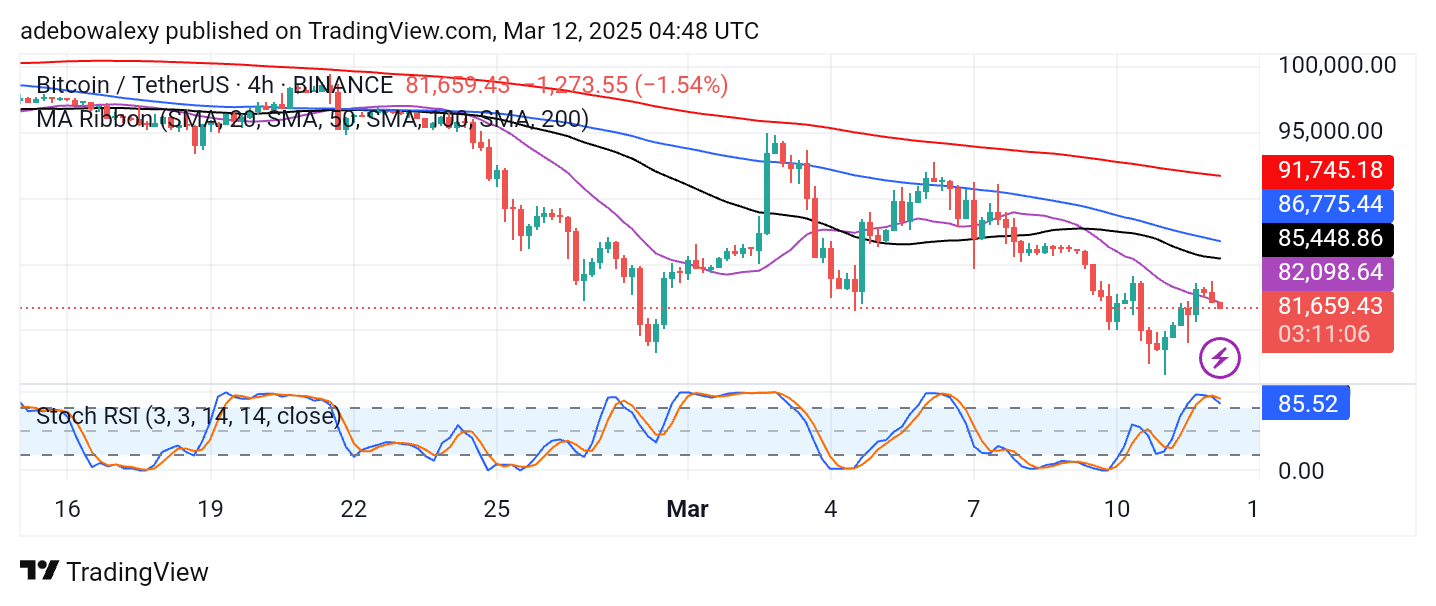
Additionally, the Stochastic RSI lines have entered the overbought region and are now moving downward toward the 80 mark. As a result, bearish pressure may extend further, leading to a potential retracement toward the $80,000 price level.