Official Trump (TRUMP/USDT) Approaches Key Decision Zone After Strong Rebound—Will Bulls Hold Momentum?
Estimated Reading Time: 3 minutes
Don’t invest unless you’re prepared to lose all the money you invest. This is a high-risk investment and you are unlikely to be protected if something goes wrong. Take 2 minutes to learn more

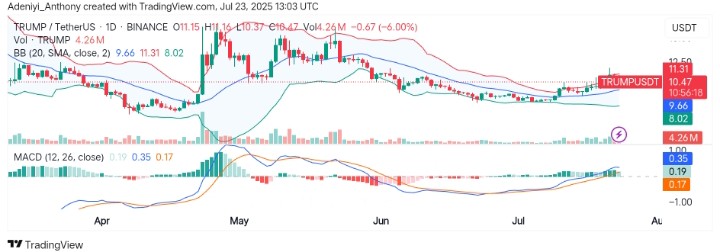
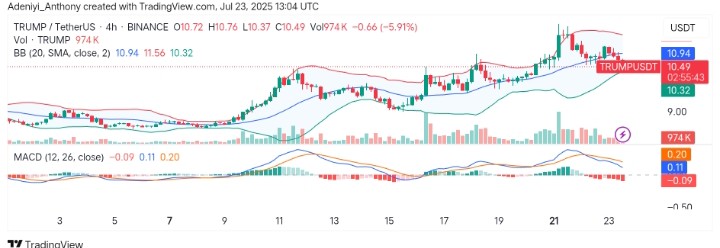
Official Trump against the Tether has shown a solid recovery after weeks of decline. The price appears to have broken the mid-Bollinger Band and is pushing for a position above the upper range.
Recently, the price action reflects growing buying interest, especially with a strong push past the $9.00 level. However, while the uptrend shows strength, price now faces a key decision area as it approaches a resistance.
To this end, the market still appears bullish, but MACD suggests waning momentum as Official Trump trades at $10.45 with 4.29 million traded volumes for the day.
Technical Indicators
Major Resistance Levels: $11.41, $12.50, and $13.80
Major Support Levels: $10.00, $9.69, and $7.97
Trump Technical Analysis
After a long consolidation and the breakout above $9.00, Official Trump has turned several upper regions into support. However, current price actions show the pair is at a critical junction, but the expansion of the bands indicates a bigger change may occur in either direction if participation increases.
From another angle, the MACD histogram is still green and above the signal line, indicating the bullish trend is still in progress but waning.
To this end, with the expanding bands, a move above $11.41 would determine a move towards $12.50 in the coming session. Conversely, a break below $10.00 would send the pair back to its initial support.
TRUMP/USDT Analysis: Expectations
On the 4-hour chart, TRUMP/USDT now operates below its mid-Bollinger Band, showing the uptrend remains intact despite a slight pullback in price. However, the price has touched $11.64 before facing short-term resistance, suggesting bulls are testing momentum near the top band.
Beneath the chart, the MACD histogram is flattening, and a mild bearish crossover has appeared, hinting at a minor dip. To this end, with the nearest support around the $10.00 level, a price bounce at this point with increased volume would be a northbound move; otherwise, a deeper correction may be witnessed.
You can purchase crypto coins here. Buy LBlock