Cardano (ADA/USDT) Eyes Recovery Amid Oversold Conditions
Estimated Reading Time: 3 minutes
Don’t invest unless you’re prepared to lose all the money you invest. This is a high-risk investment and you are unlikely to be protected if something goes wrong. Take 2 minutes to learn more
Cardano Long-term Analysis: Bullish
The Cardano market against the Tether has faced serious selling pressure in recent times. However, the pair has shown resilience by maintaining a position above key support zones.
Recently, the pair’s price movement has shown ADA is testing the 200 simple moving average at $0.7202 and quickly moving to the north with increasing volumes. However, this hints at a possible trend reversal in the long term, but the oversold condition of the Stochastic RSI signals the improvement is still young, and more upside moves are needed to confirm the reversal.
Currently, Cardano trades at $0.6348, recording a 10.65% gain and over 1 billion traded volumes.
Technical Indicators
Major Resistance Levels: $0.7202, $0.8680, and $1.000
Major Support Levels: $0.6020, $0.5096, and $0.4500
Cardano Technical Analysis
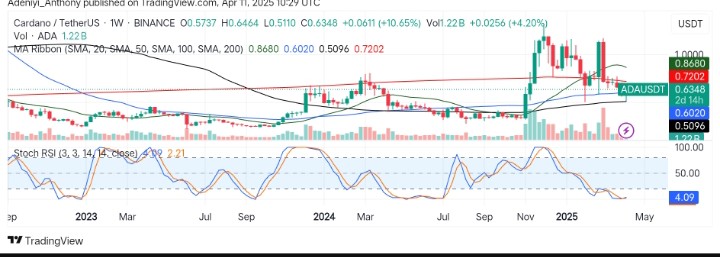
The analysis of the Cardano against the Tether on the weekly timeframe shows the pair is recovering after ranging for a prolonged period of time. The recent price action around the 200 SMA hints at a potential reversal. However, the immediate overhead resistance levels remained significant and must be cleared for a sustained bullish move.
On the other hand, the Stochastic oscillator shows the pair is in the oversold territory, with the blue line now operating above the orange line, suggesting a confirmed bullish crossover could be imminent. However, a crossover at this level might signal the start of a short-term upward momentum.
To this end, a break above $0.7202 would signal a break above $1.000 in the near term; otherwise, a break below the current level could lead to a move towards $0.5096.
ADA/USDT Analysis: Where from Here?
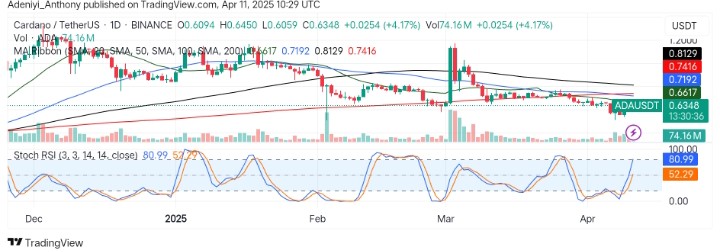
On the daily chart, ADA/USDT is displaying renewed optimism as the pair gained more momentum with increasing buying pressure. However, recent price action hints at a move towards the 20-SMA, suggesting more improvement to the north could be realized.
The oscillator on the daily chart confirms a strong bullish movement. However, sustained momentum is needed for continued upside movement.
To this end, if ADA can break above $0.6617, a move toward further resistance might play out. On the contrary, a break below the current level would suggest a move below the $0.6000 level.
You can purchase crypto coins here. Buy LBlock