Chainlink (LINK/USDT) Targets More Gains Amidst Market Growing Concern
Estimated Reading Time: 3 minutes
Don’t invest unless you’re prepared to lose all the money you invest. This is a high-risk investment and you are unlikely to be protected if something goes wrong. Take 2 minutes to learn more

Chainlink Long-term Analysis: Bullish
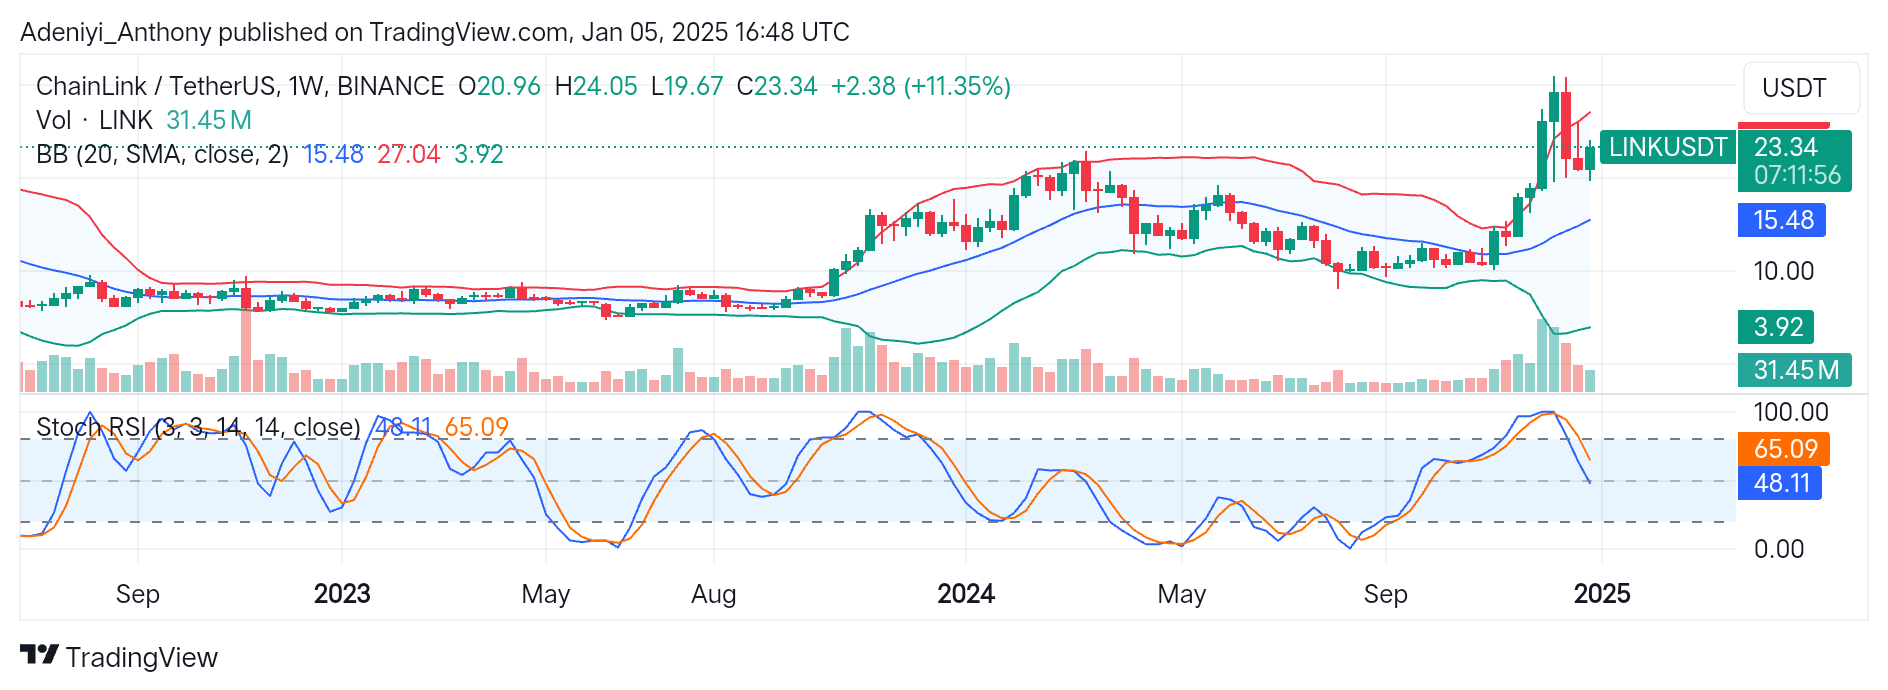
The market for Chainlink against the Tether on a weekly timeframe reflects strong bullish momentum, evidenced by a recent price movement above $27.04. However, the price has seen a minor dip from the recent high in the meantime, suggesting some profit-taking actions.
Recently, Chainlink looks to be eyeing a recovery as weekly trade sees a gain of 11.35%, suggesting strong market interest as price trades above the middle Bollinger band. However, the contrary position of the Stochastic RSI shows the tendency of retracing towards the $20.00 level before potential upside movement.
Currently, Chainlink is trading at $23.34 with over 31 million traded volumes for the week.
Technical Indicators
Major Resistance Levels: $24.05, $27.04, and $30.00
Major Support Levels: $20.00, $15.48, and $10.00
Chainlink Technical Analysis
The analysis of Chainlink against the Tether on a weekly timeframe shows a market poised for a continued uptrend despite growing downside concerns. However, the price between the upper segment of the Bollinger band shows that the pair looks seemingly overextended.
On the other hand, the Stochastic oscillator at the bottom of the chart suggests waning momentum despite accumulated buying interest. To this end, a gain above $24.05 could trigger more upside gain; otherwise, a break below the $20.00 level could lead to the retest of the $15.48 mid-band level.
LINK/USDT Analysis: Where from Here?
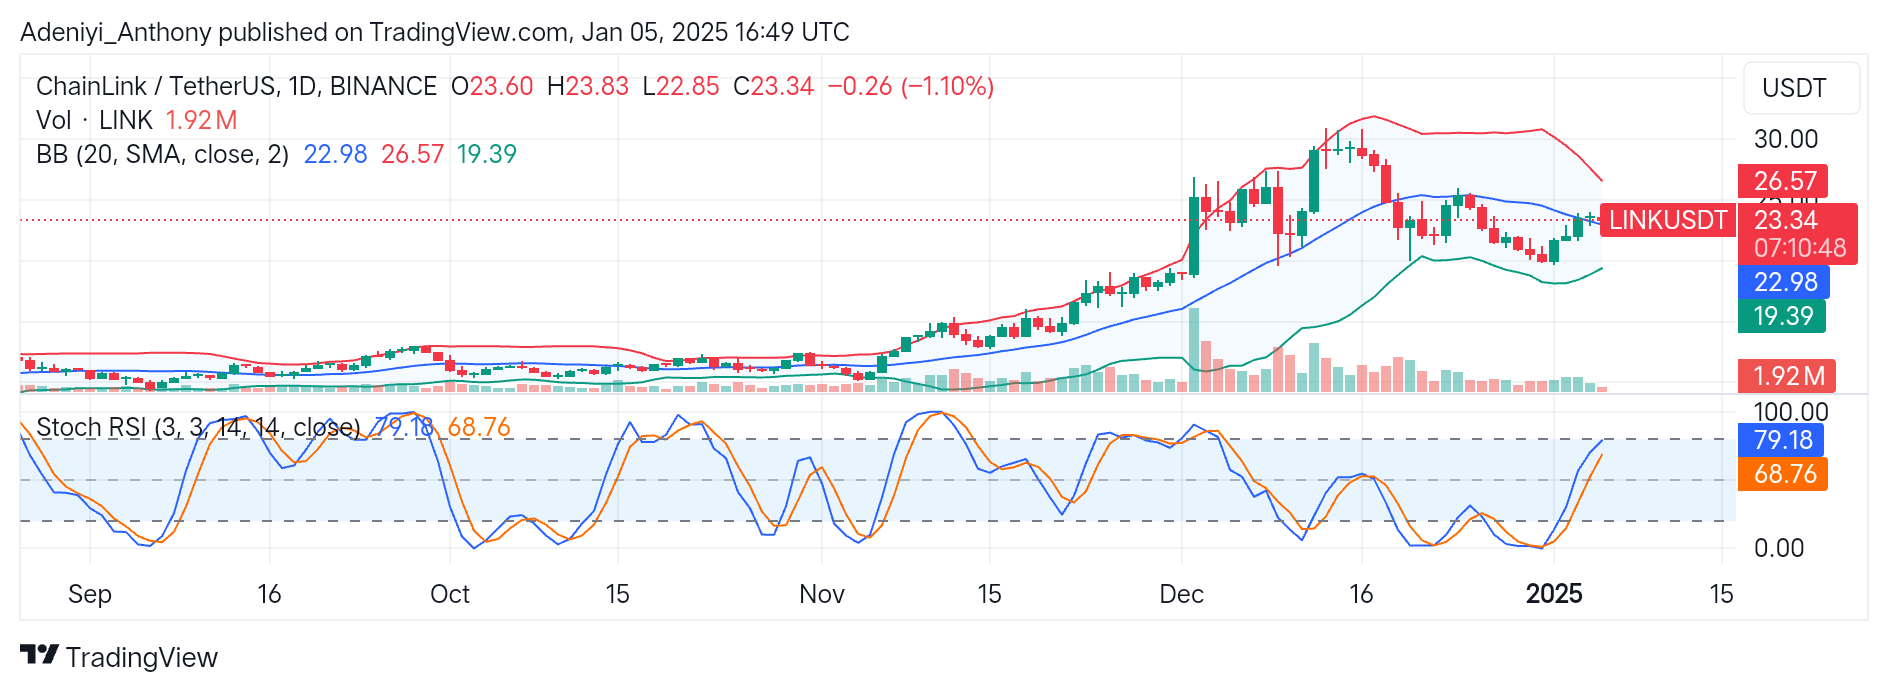
On the daily timeframe, the LINK/USDT appears to be slightly down by 1.10% as the price consolidates within a tight range after the recent rally above the mid-band at $22.98. This action suggests neither the bulls nor the bears dominate the market, as indicated by the low daily trading volumes.
On the other hand, the Stochastic RSI points at possible exhaustion in bullish momentum, as the lines operate in the overbought region. However, a bearish crossover is needed to confirm this position as the indicator reads 79.18 and 68.76.
To this end, traders need to monitor price behavior around the midline and the positioning of the Stochastic line for directional bias. A close above the mid-line could signal a continuation of the trend; otherwise, a close below $22.50 could signal a correction towards $19.39 before a longer-term directional move.
You can purchase crypto coins here. Buy LBlock
