Lucky Block Price Prediction: LBLOCK/USD Ranges; Time for More Buyers to Surface
Estimated Reading Time: 3 minutes
Don’t invest unless you’re prepared to lose all the money you invest. This is a high-risk investment and you are unlikely to be protected if something goes wrong. Take 2 minutes to learn more

Free Crypto Signals Channel
The Lucky Block price prediction may recover to the upside as the coin crosses below the moving averages to touch $0.00613 level.
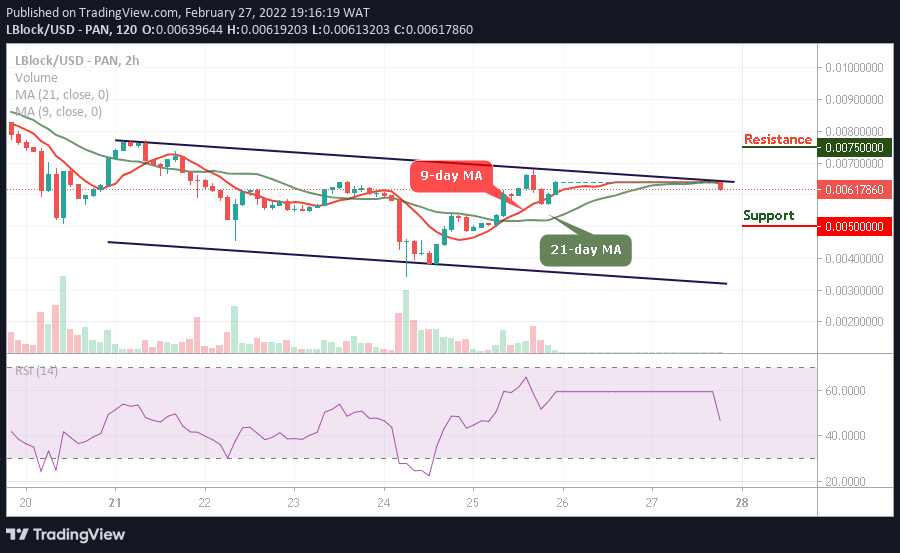
LBLOCK/USD Medium-term Trend: Ranging (2 Hour Chart)
Key Levels:
Resistance levels: $0.0075, $0.0080, $0.0085
Support levels: $0.0050, $0.0045, $0.0040
According to the 1-hour chart, LBLOCK/USD is ranging as the market price slides below the 9-day and the 21-day moving averages. Meanwhile, the market is becoming cheaper so that the new and existing buyers could buy the dip. However, should the bulls fail to push the price upward, the Lucky block price may move sideways for a little time before heading to the upside.
Lucky Block Price Prediction: LBLOCK/USD Would Move Higher
The Lucky Block price would rise and break above the 9-day and 21-day moving averages to cross the upper boundary of the channel if the bulls defend the $0.00630 support level. Therefore, any further bullish movement above the channel may push the price to the potential resistance levels of $0.0075, $0.0080, and $0.0085.
Moreover, this analysis may not be validated if the bears remain below the 9-day and 21-day moving averages to touch the low of $0.0050, $0.0045, and $0.0040 support levels. Moreover, the technical indicator Relative Strength Index (14) slumps below 50-level to prepare for more positive movements.
LBLOCK/USD Medium-term Trend: Ranging (1 Hour Chart)
Against Bitcoin, the Lucky Block price would cross above the 9-day and 21-day moving averages to touch the major resistance level at $0.0070. However, if the buyers push the price and move towards the upper boundary of the channel, higher resistance could be reached at $0.0075 and above.
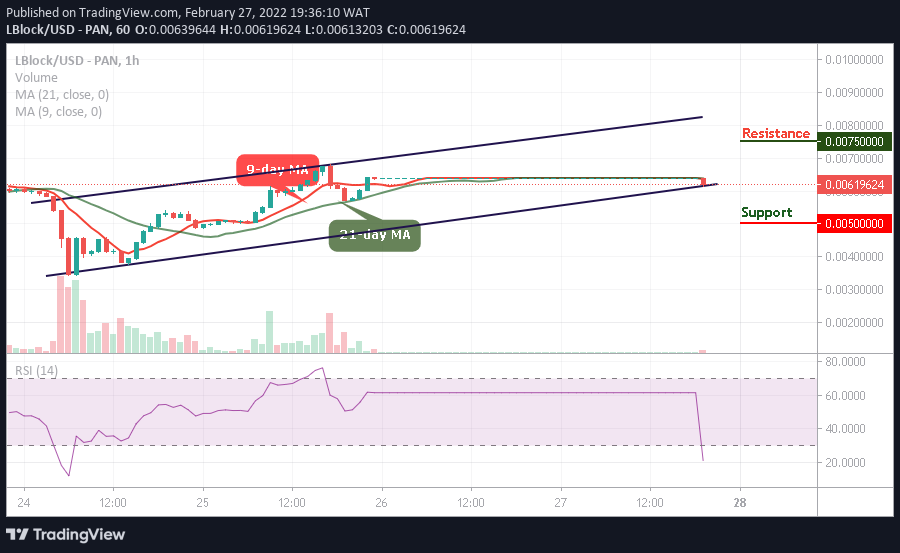
Moreover, the technical indicator Relative Strength Index (14) slumps to the oversold region, indicating that bullish signals are coming to play. Moreover, should the bulls fail to move the current market value above, the bears may step back into the market and the nearest support level could be located at $0.0050 and below.
Read more: