Polkadot (DOT/USDT) Faces Strong Resistance Amid Narrow Consolidation
Estimated Reading Time: 3 minutes
Don’t invest unless you’re prepared to lose all the money you invest. This is a high-risk investment and you are unlikely to be protected if something goes wrong. Take 2 minutes to learn more
Polkadot Long-term Analysis: Ranging
The market for Polkadot against the Tether has been displaying signs of stability after a prolonged downtrend around the beginning of the year. However, after experiencing a rally towards the $4.600 level in the previous session, the pair appears to be hovering around the dynamic 20-period line of the Bollinger Bands.
Recently, the Bollinger Bands seem to be converging, suggesting a big move in the near term. However, the momentum indicator signals a loss of bullish strength as the pair now operates below the previous candle. This suggests the price may be heading south if the bulls fail to re-enter the market.
Currently, Polkadot trades at $4.521, printing over 8.5 million traded volumes for the week.
Technical Indicators
Major Resistance Levels: $4.621, $5.500, and $6.040
Major Support Levels: $4.000, $3.600, and $3.200
Polkadot Technical Analysis
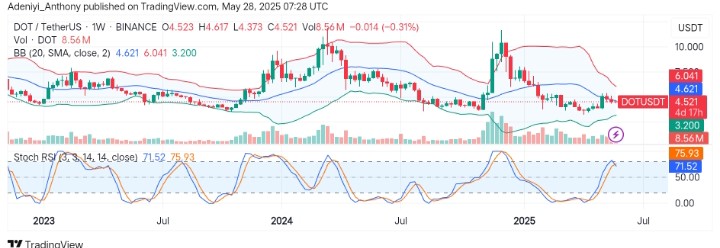
On the weekly timeframe, Polkadot against the Tether has maintained a sideways movement, hovering around the $4.621 dynamic level, with the Bollinger Bands suggesting a buildup of volatility.
From another angle, the Stochastic RSI shows the pair operates at the overbought level, suggesting bullish momentum. However, with a bent in the lines to the south, the pair may pull back on a south term before making above $4.621, provided bullish volume increases. To this end, a break above $4.630 with increasing bullish participation may propel the price towards $6.040.
Conversely, a break below $4.000 with a spike in bearish participation may pull the price further south below $3.600.
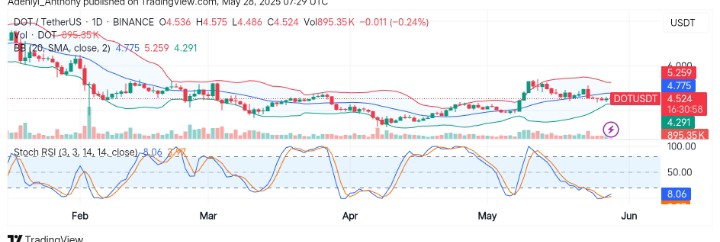
DOT/USDT Analysis: A Breakout or Breakdown?
The daily chart of DOT/USDT shows the pair is consolidating within tightening bands, and a Stochastic oscillator reveals the possibility of an impending bullish move. However, with major resistance at $4.775, a waning bearish momentum, and a break above the dynamic line may lead to a move above $5.000.
Conversely, failure to reclaim this level would invite further tests of the $4.3000 support level.
You can purchase crypto coins here. Buy LBlock