Solana (SOL) Price Prediction: SOL/USDT Oscillates Above the $130.00 Mark
Estimated Reading Time: 3 minutes
Don’t invest unless you’re prepared to lose all the money you invest. This is a high-risk investment and you are unlikely to be protected if something goes wrong. Take 2 minutes to learn more
Solana (SOL) Price Prediction: September 13
Price activity in the Solana market has taken off from support around the $123.00 price level. The market has climbed past the $130.00 threshold. However, today’s session seems to show that the market has hit a rejection at the $134.00 mark.
SOL/USDT Long-term Trend: Bullish (Daily Chart)
Key Price Levels:
Resistance: $135.00, $140.00, $145.00
Support: $130.00, $125.00, $120.00
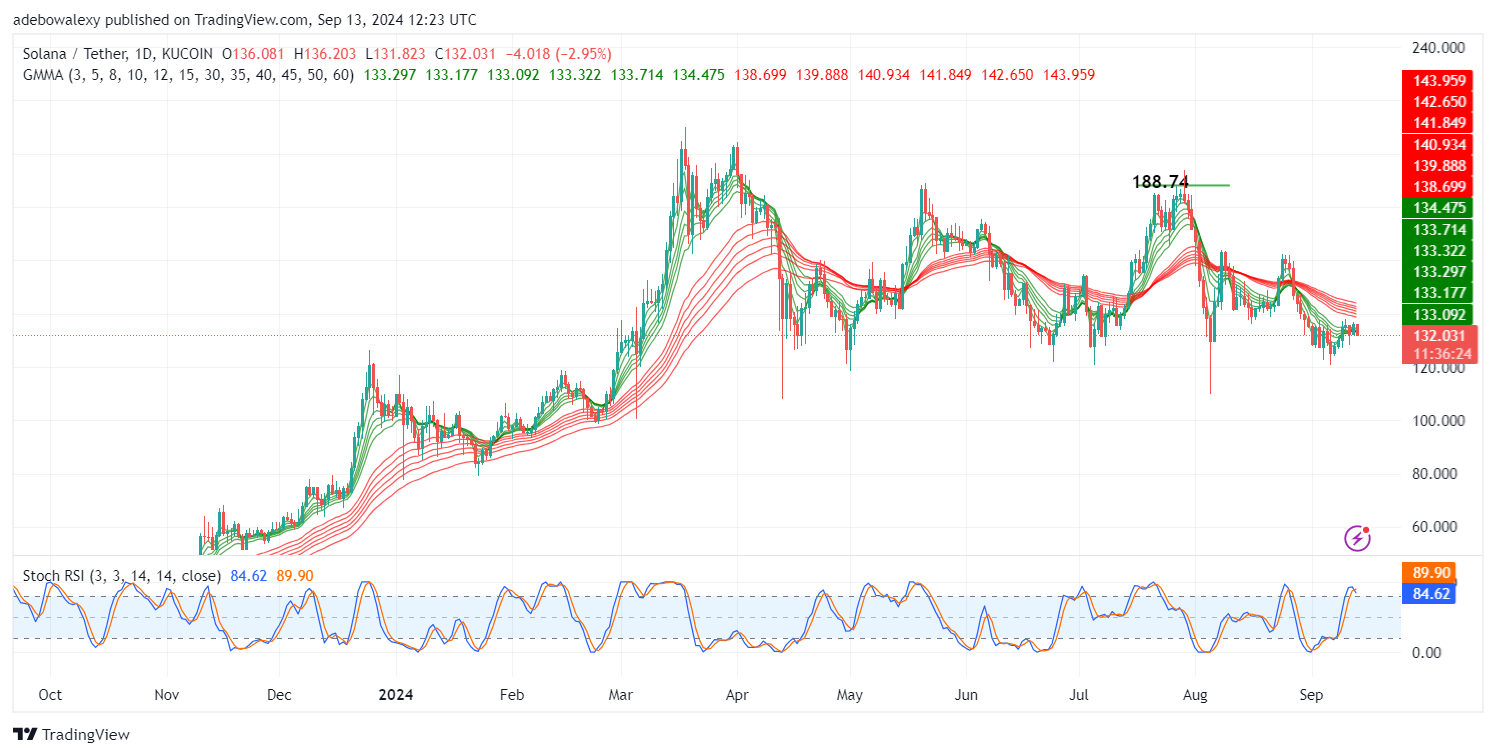
Before the downward rebound seen in the ongoing session, price activity had been oscillating sideways within a narrow range of $134.50 and $130.00. The corresponding price candle for the ongoing session can be seen dipping below the green set of Guppy Multiple Moving Average (GMMA) lines. Additionally, the Stochastic Relative Strength Index (Stochastic RSI) lines have delivered a bearish crossover in the overbought region.
Solana (SOL) Price Prediction: SOL/USDT May Attack the $130.00 Baseline
Price action in the Solana market has failed to progress past an important mark on the GMMA indicator. The last price candle on the chart has wiped out all the minimal gains seen in the past two to three sessions. Also, downward forces have affected a crossover on the Stochastic RSI indicator, hinting that bearish forces are gaining strength.
At this point, it seems likely that downward forces may drive the market to revisit the support at the $130.00 mark. Considering the signs from technical indicators, it appears that price activity may extend its downward retracement toward lower price levels. However, a closer examination may be necessary for more informed decisions.
Solana (SOL) Price Prediction: SOL/USDT Heads South (4-Hour Chart)
Looking at the Solana market, it appears to be taking on a more bearish stance. Here, price action can be seen falling below the converging GMMA lines. Price action failed to rise back above the two sets of the GMMA indicator during the past two sessions.
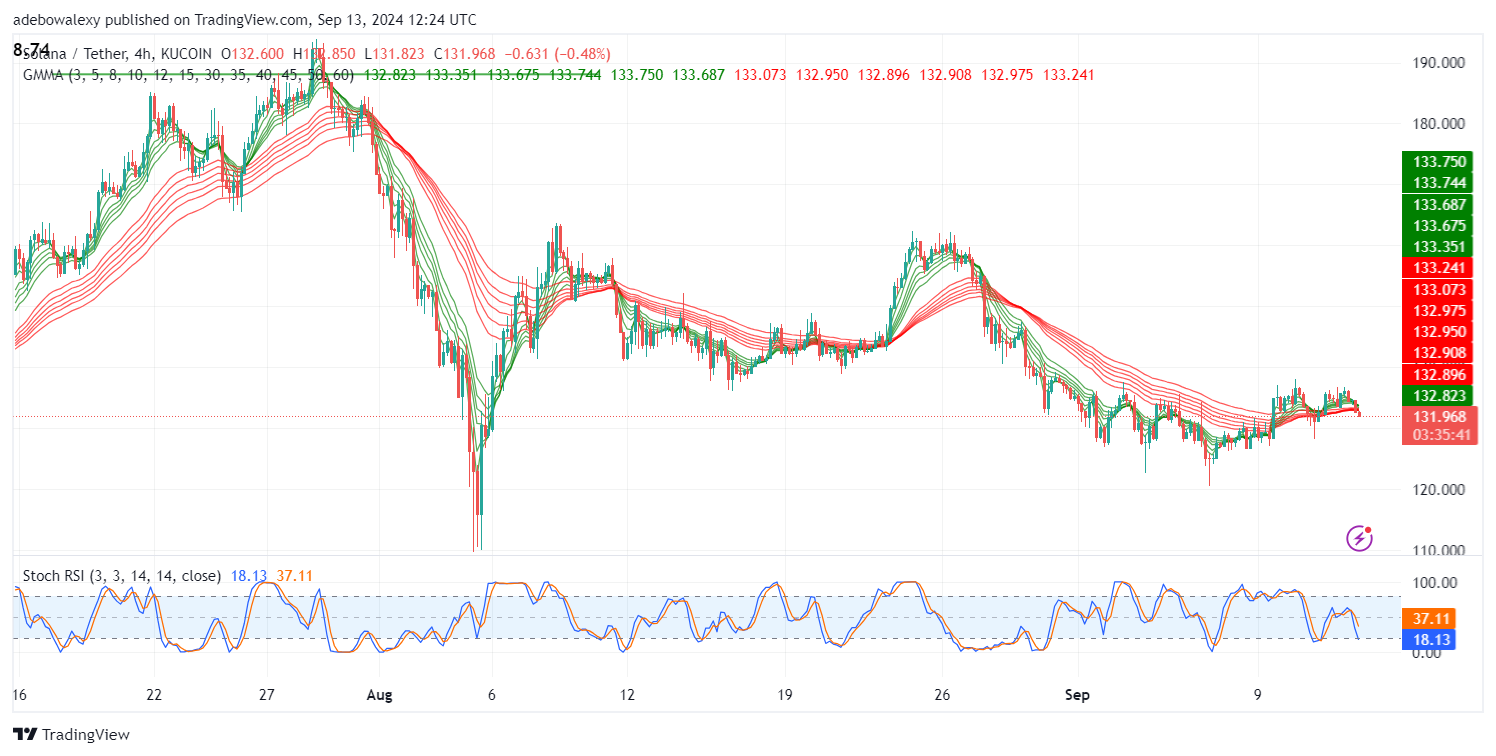
As a result, subsequent sessions have descended. The last price candle can now be seen appearing below the converging GMMA lines. Additionally, the Stochastic RSI lines are descending into the oversold region. Therefore, SOL’s price is more likely to challenge the support at $130.00, and if downward forces are strong enough, we may witness a drop to the $125.00 threshold.