Uniswap (UNI) Price Prediction: UNI/USDT Trades Near the $7.00 Resistance Level
Estimated Reading Time: 3 minutes
Don’t invest unless you’re prepared to lose all the money you invest. This is a high-risk investment and you are unlikely to be protected if something goes wrong. Take 2 minutes to learn more

Uniswap (UNI) Price Prediction: September 12
For some time now, the Uniswap market has been trading slightly below the $7.00 threshold. However, the token’s price action has been steadily rising toward this resistance level.
UNI/USDT Long-term Trend: Bullish (Daily Chart)
Key Price Levels:
Resistance: $7.00, $8.00, $9.00
Support: $6.00, $5.00, $4.00
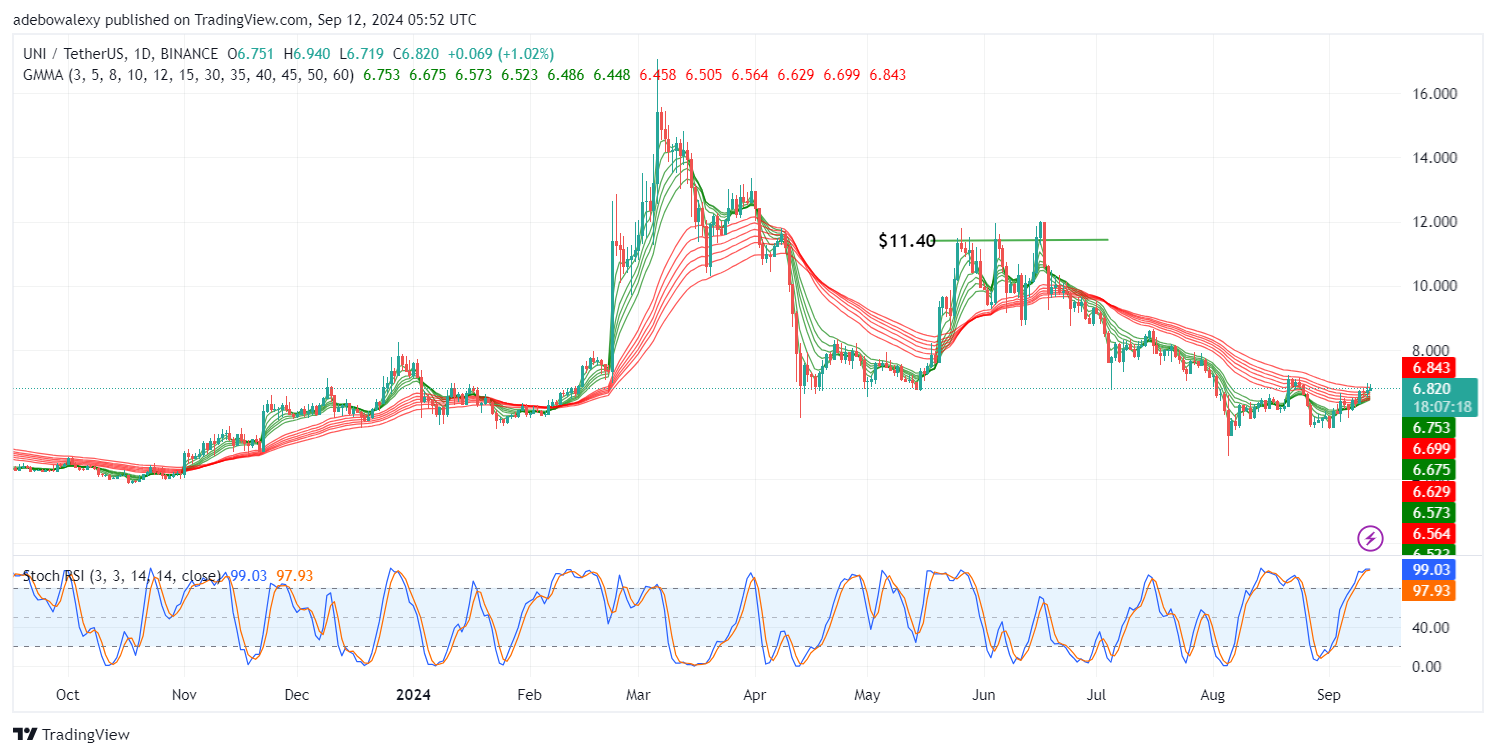
Over the past four sessions, Uniswaps’s price activity has shown minimal but consistent upward progress. Currently, price action has almost risen through all the Guppy Multiple Moving Average (GMMA) curves. Additionally, the last price candle remains green, testing the final GMMA indicator line. Moreover, the Stochastic Relative Strength Index (Stochastic RSI) lines have risen into the overbought region and appear poised to move sideways at the terminal level.
Uniswap (UNI) Price Prediction: Can UNI/USDT Bulls Sustain the Momentum?
Uniswap’s price action has generally maintained an upward trajectory in recent times. While there have been some interruptions along the way, bullish forces have quickly recovered, pushing the market through the GMMA lines. The behavior of the Stochastic RSI suggests that upward pressure may continue to build.
From a technical standpoint, the current indicators align to suggest that the market may still have room to progress further. However, a more critical analysis is required to gauge how far the market could advance.
Uniswap (UNI) Price Prediction: UNI/USDT Bulls Experience a Shock (4-Hour Chart)
While the Uniswap market has been in a general upward trend, the latest price candle on the 4-hour chart indicates that bullish forces may have encountered a considerable shock. The most recent price candle is red, suggesting that bearish forces are leading the session. This has pushed the price of the pair below several GMMA lines. Additionally, the Stochastic RSI lines are moving downward following a crossover above the 50 mark of the indicator.
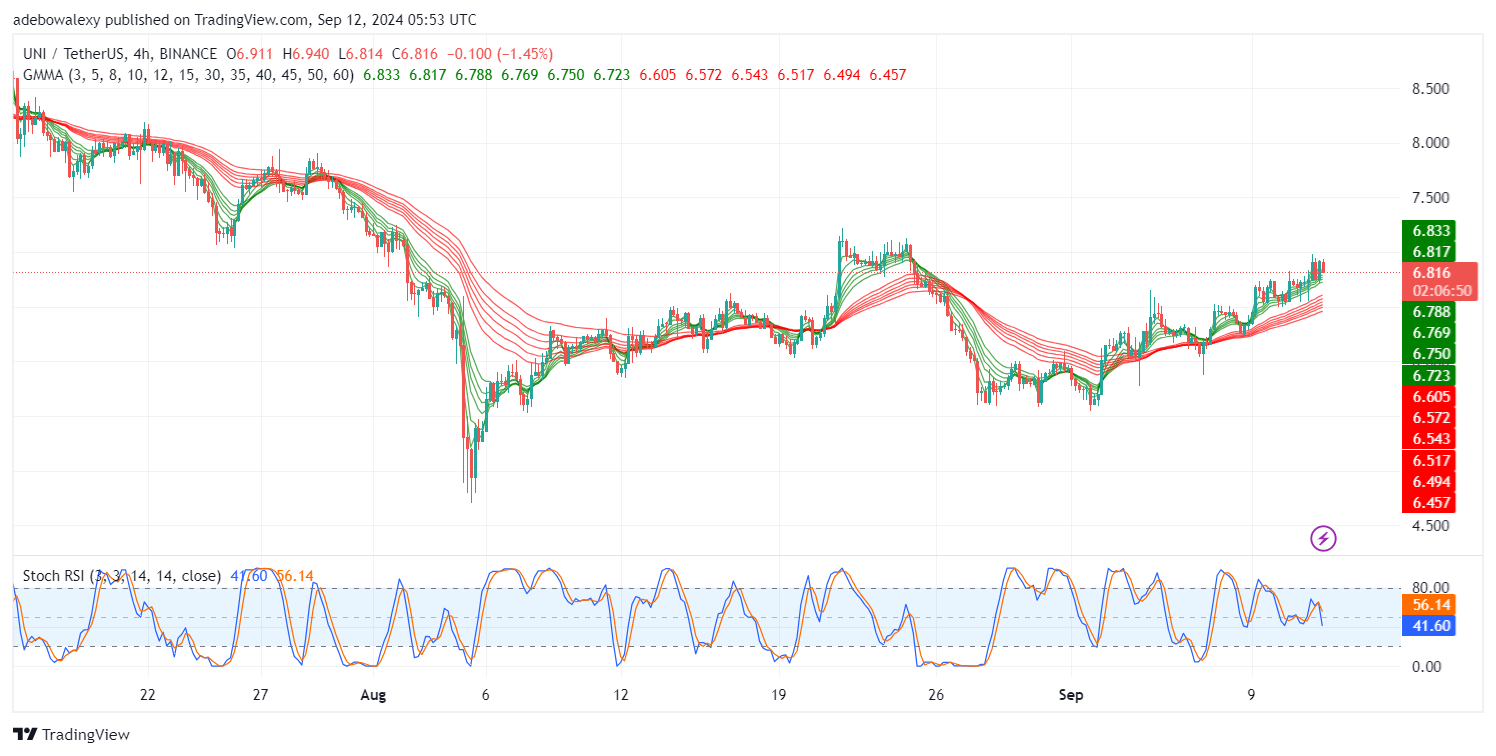
Technically, this indicates that bearish forces may gain further momentum, potentially pushing the market to retest the $6.00 price level. However, based on recent price history, traders might also consider targeting price levels just above the $7.00 mark. In any case, caution is advised to ensure proper risk management.