Lucky Block (LBLOCK): Gearing Up for a Rebound from Key Support
Estimated Reading Time: 3 minutes
Don’t invest unless you’re prepared to lose all the money you invest. This is a high-risk investment and you are unlikely to be protected if something goes wrong. Take 2 minutes to learn more

Lucky Block (LBLOCK), a standout innovator in the crypto-gaming space, is currently navigating a critical technical juncture. While the short-term chart shows a period of contraction, the underlying technical indicators are hinting at a potential reversal. This phase of consolidation is a natural and healthy process, often preceding a significant directional move, and the setup suggests the foundations are being laid for a positive upward shift.
Daily Chart Analysis: Consolidation Within a Bullish Structure
The daily chart presents a compelling picture of an asset building energy for its next major move. LBLOCK is currently trading within the confines of its Bollinger Bands (20, 2), a key indicator of volatility. The bands are notably tightening, a phenomenon known as a “squeeze,” which historically signals that a period of low volatility is about to explode into a high-volatility breakout.
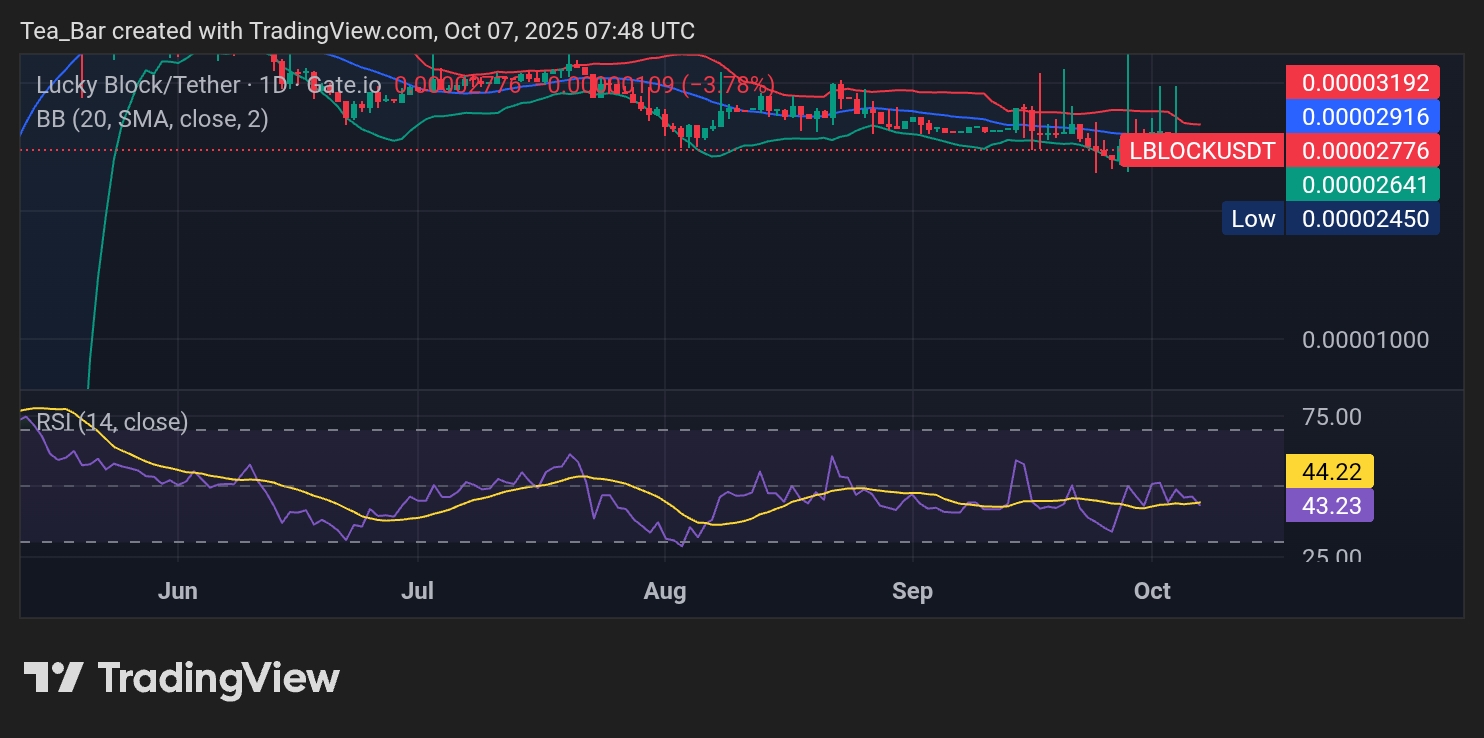
The price is finding a stable footing above the critical support level of $0.00002450. Holding above this zone is crucial and demonstrates resilience. The current pullback to the $0.00002776 level can be viewed as a healthy retest of support after its previous moves, offering a potential accumulation zone for investors before the next leg up. The RSI on the daily timeframe is resetting from neutral levels, providing ample room for upward momentum to build.
4H Chart Analysis: Oversold Conditions Signal a Buying Opportunity
The 4-hour chart offers a more tactical view, revealing a prime opportunity for entry. The recent -3.78% dip has brought the price to a key support cluster and, more importantly, has pushed the RSI (14) into oversold territory. An RSI reading this low typically indicates that selling pressure is exhausting itself and a technical bounce is highly probable.
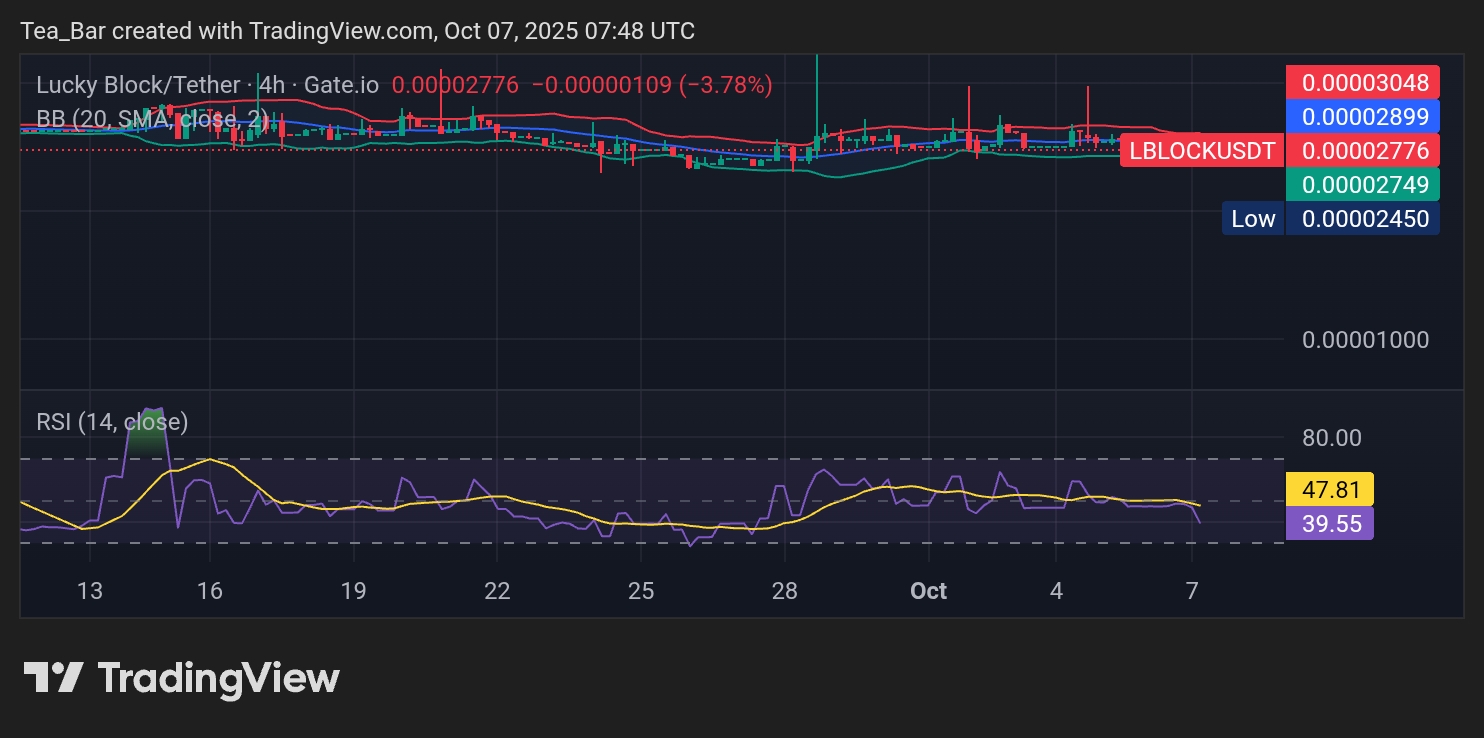
The price is now hovering near the lower Bollinger Band, which often acts as a dynamic support level in a trending market. A firm hold at the $0.00002776 level, followed by a break above the $0.00002899 resistance, would serve as a strong confirmation that the bulls are regaining control and a reversal is underway.
Conclusion: A Compelling Setup for Astute Investors
Lucky Block is demonstrating a classic technical setup that often precedes a powerful price advance. The convergence of a Bollinger Band squeeze on the daily chart and deeply oversold conditions on the 4-hour chart creates a potent mix for a potential rebound.
For investors with a vision for the project’s strong fundamentals in the NFT and gaming lottery space, this temporary weakness represents a strategic window of opportunity. The risk-reward profile at these levels is highly attractive, positioning LBLOCK for a potential surge as it breaks out of its current consolidation pattern.
Invest wisely, and let Lucky Block’s potential work in your favor. You can purchase Lucky Block here. Buy LBLOCK.