Lucky Block Awakens: LBLOCK Sets the Stage for a Bullish Comeback
Estimated Reading Time: 3 minutes
Don’t invest unless you’re prepared to lose all the money you invest. This is a high-risk investment and you are unlikely to be protected if something goes wrong. Take 2 minutes to learn more

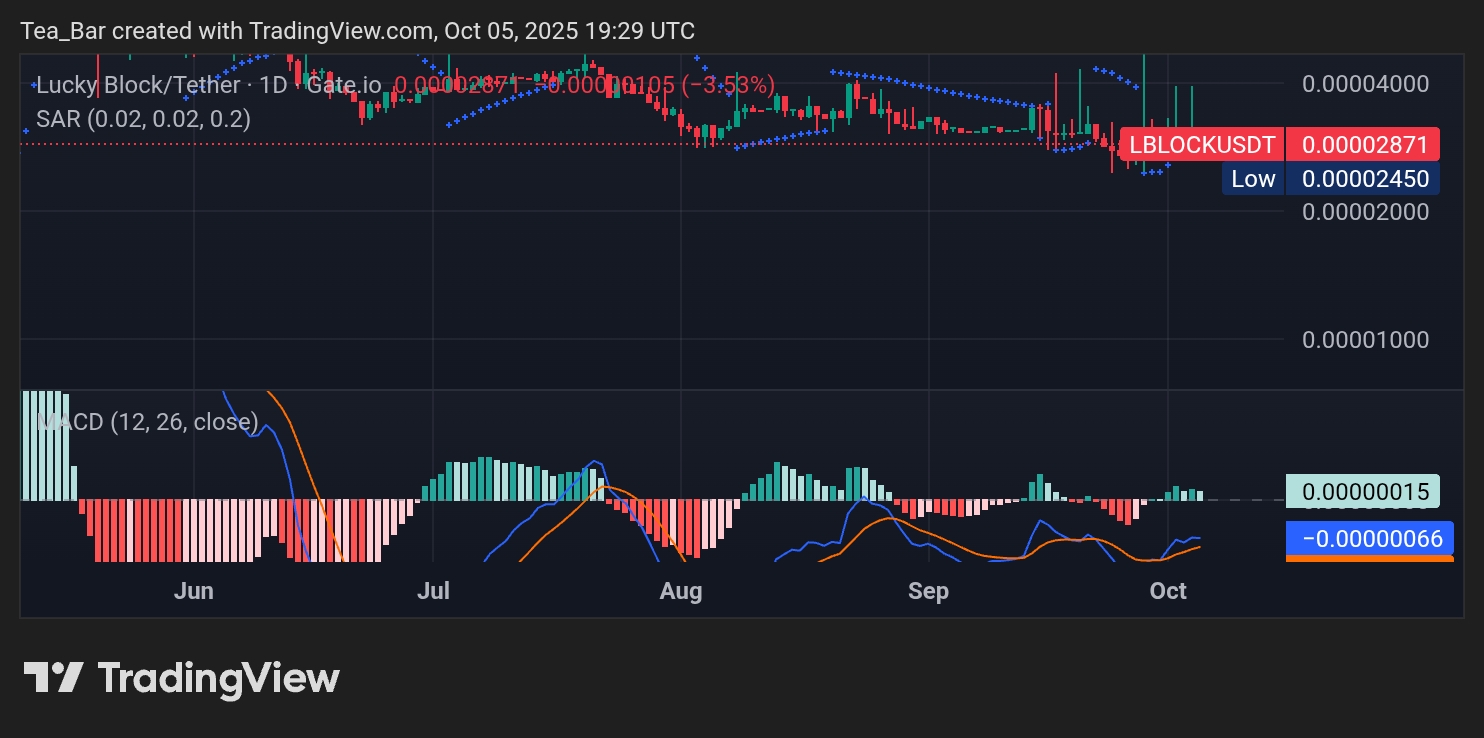
Lucky Block (LBLOCK) continues to display strong resilience in the crypto market, showing signs of renewed strength as it consolidates around $0.00002871. The project’s innovative approach and active community have helped sustain investor optimism despite short-term fluctuations. With market confidence gradually improving, Lucky Block could be gearing up for another wave of bullish momentum as it targets higher resistance zones in the coming days.
LBLOCK Daily Chart Analysis: Poised for a Rebound
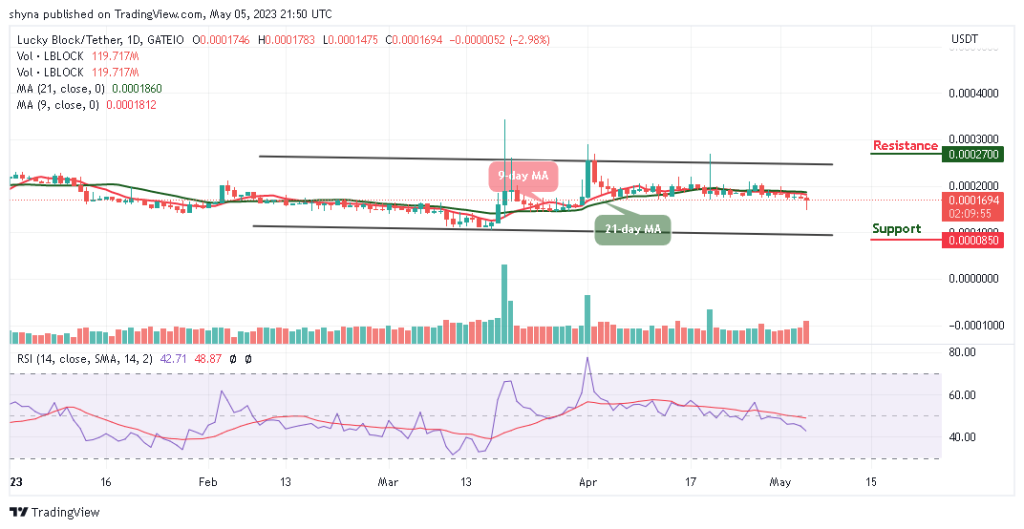
On the daily chart, LBLOCK has held firm above the $0.00002450 support level, reflecting a steady base for upward movement. The Parabolic SAR dots are beginning to flatten below recent candlesticks, hinting at a potential trend reversal as buyers regain control. This suggests growing market confidence, especially as the coin continues to hold its ground despite minor pullbacks.
The MACD indicator is also showing encouraging signs of momentum recovery. While the histogram has fluctuated around the zero line, the blue MACD line is edging closer to a bullish crossover above the signal line. A sustained close above $0.00003442 could spark a fresh uptrend, with the next target positioned near $0.00004300 if bullish sentiment strengthens further.
LBLOCK 4-Hour Chart Analysis: Bulls Regaining Momentum
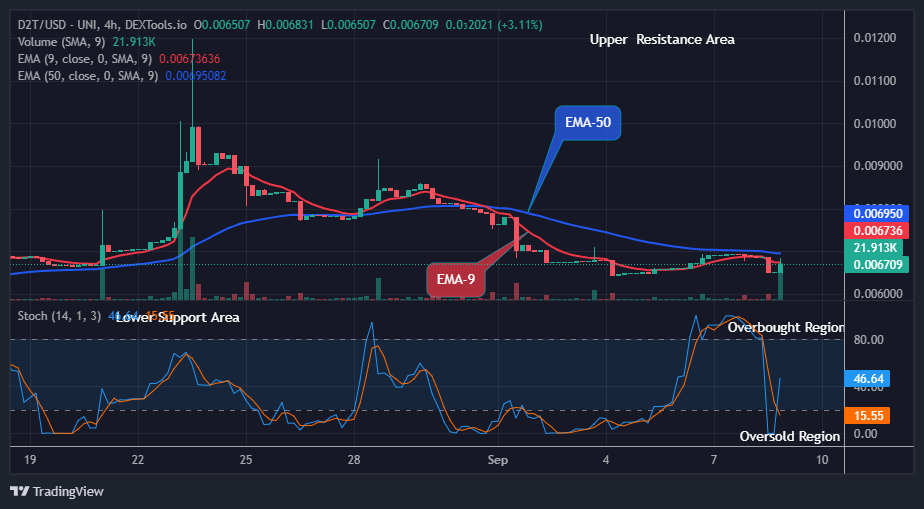
Zooming in on the 4-hour chart, Lucky Block is navigating within a tight range, maintaining price stability between $0.00002450 and $0.00003465. The Parabolic SAR dots are shifting positions closer to the candles, signaling a potential breakout in favor of the bulls. This setup reflects consolidation before a possible push upward, as short-term traders look for confirmation above the upper boundary.
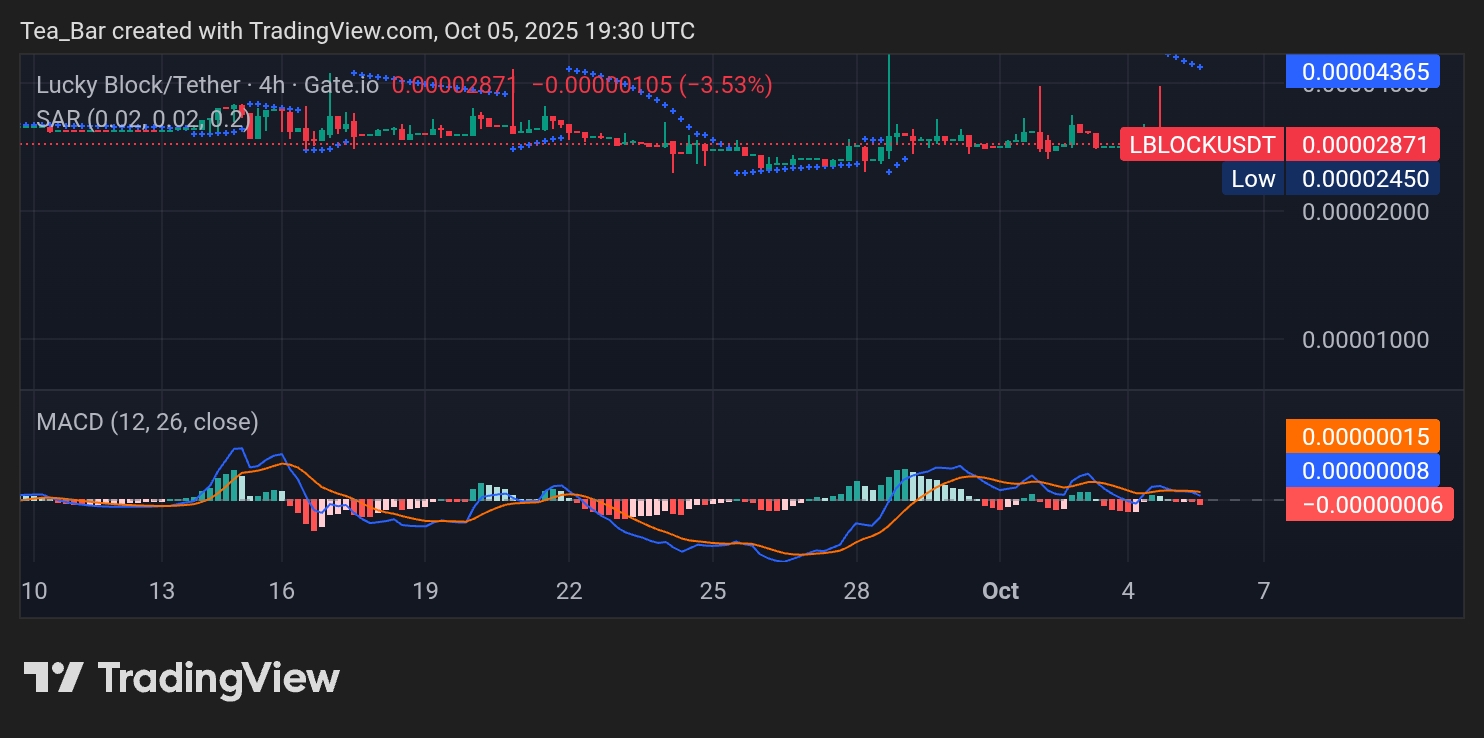
The MACD histogram on the 4-hour timeframe is gradually turning positive, aligning with the emerging bullish tone. The proximity of the MACD and signal lines suggests that momentum is building. If buying volume expands, LBLOCK could easily push beyond the $0.000034 range and pave the way for a more sustained rally. With renewed enthusiasm surrounding Lucky Block, the token remains one of the most exciting low-cap plays to watch as October unfolds.
Invest wisely, and let Lucky Block’s potential work in your favor. You can purchase Lucky Block here. Buy LBLOCK.