Lucky Block (LBLOCK) Price Analysis: Signs of Strength as Momentum Builds
Estimated Reading Time: 3 minutes
Don’t invest unless you’re prepared to lose all the money you invest. This is a high-risk investment and you are unlikely to be protected if something goes wrong. Take 2 minutes to learn more

Lucky Block (LBLOCK) has shown fresh signs of life, trading at $0.00002874 with a modest 1.41% gain. After a period of consolidation, the token is beginning to display bullish undercurrents supported by improving momentum indicators. With technical signals strengthening across both daily and 4-hour charts, LBLOCK looks well-positioned to regain higher ground as buyers step back in.
Daily Chart: Consolidation Near Key Levels
On the daily timeframe, LBLOCK is stabilizing near $0.00002874, with the Bollinger Bands tightening, indicating that a significant price move could be imminent. The support around $0.00002605 has been holding firmly, offering buyers a reliable base from which to accumulate positions. The token’s ability to remain within this range highlights resilience, particularly as market conditions remain mixed across the broader crypto space.
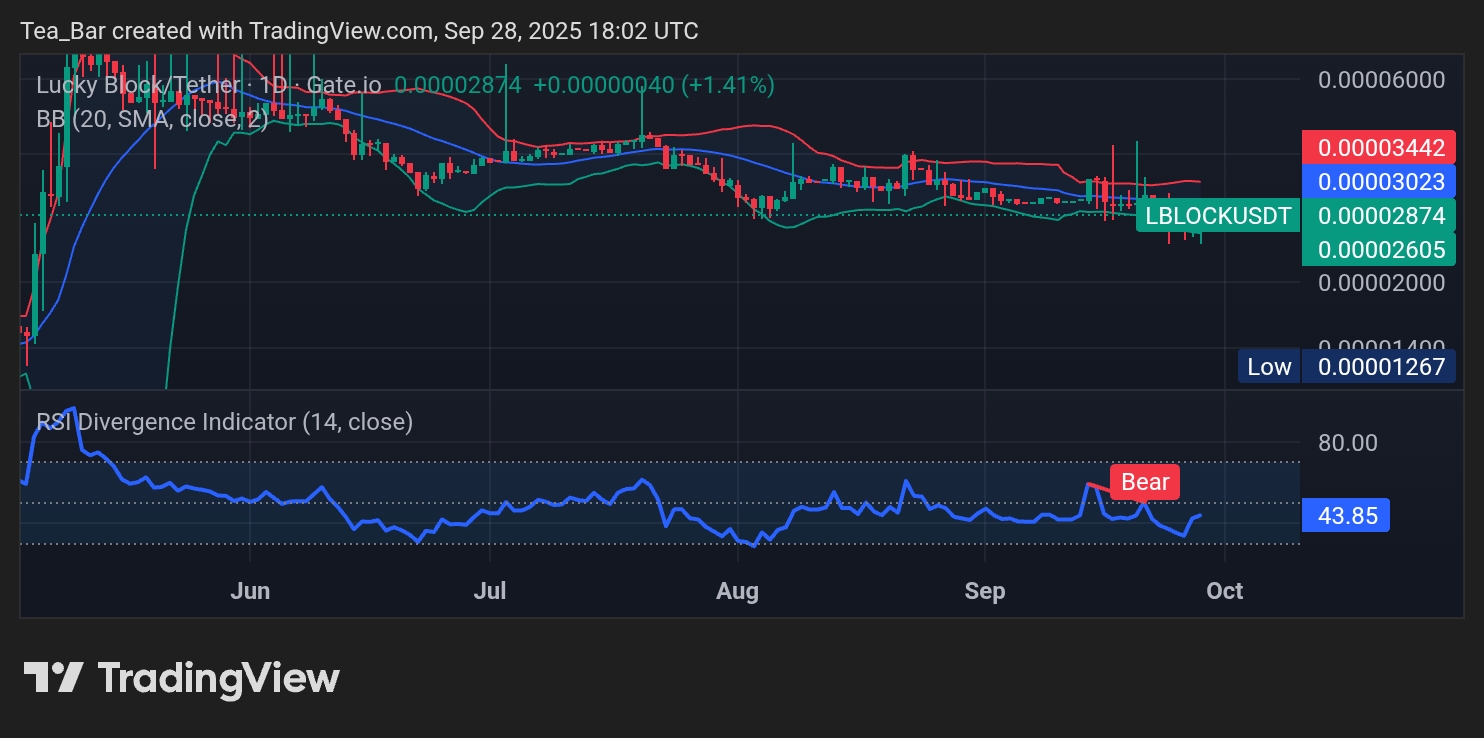
The RSI currently stands at 43.85, gradually recovering from oversold conditions. This suggests that bearish pressure is losing steam and that buyers are preparing to regain control. Should the price push beyond $0.00003023 resistance, the next key upside target sits near $0.00003442, which could unlock further bullish momentum.
4-Hour Chart: Momentum Tilts Bullish
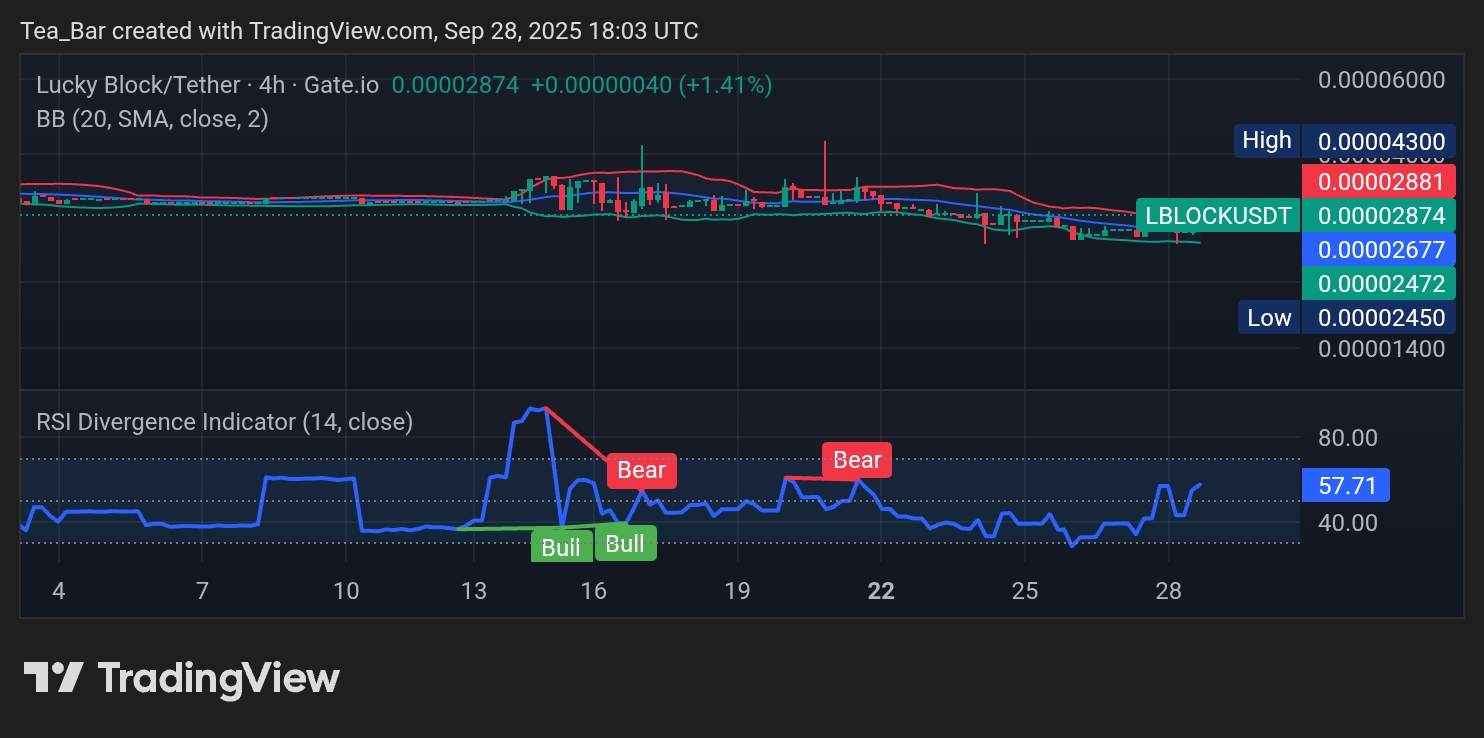
On the 4-hour chart, LBLOCK is trading above the middle Bollinger Band, a positive early sign of short-term strength. The support levels at $0.00002677 and $0.00002472 have successfully contained recent declines, providing a strong springboard for upward movement. The current price action suggests that bulls are gradually stepping in with higher confidence.
The RSI on this shorter timeframe has surged to 57.71, signaling increasing buying pressure and room for further growth before reaching overbought territory. If momentum continues, LBLOCK could quickly retest $0.00002881 and move toward the $0.00004300 high, signaling a potential breakout phase.
Conclusion: Lucky Block Shows Breakout Potential
Lucky Block is demonstrating encouraging signs of recovery, with both daily and intraday charts pointing toward strengthening bullish momentum. The resilience around key support levels and the rising RSI readings suggest that upward pressure is building. If LBLOCK manages to break through nearby resistance levels, it could attract greater investor attention and position itself for a larger rally. For traders seeking promising opportunities, Lucky Block remains an exciting project with strong potential for upside in the near term.
Invest wisely, and let Lucky Block’s potential work in your favor. You can purchase Lucky Block here. Buy LBLOCK.