Orca Market (ORCA/USD) Bulls Take Charge to Revive Price Rally
Estimated Reading Time: 3 minutes
Don’t invest unless you’re prepared to lose all the money you invest. This is a high-risk investment and you are unlikely to be protected if something goes wrong. Take 2 minutes to learn more

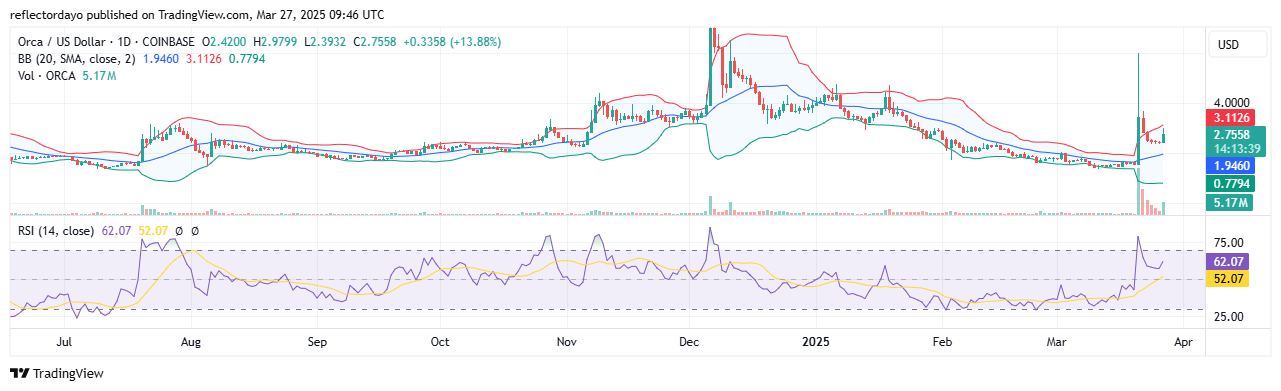
The price of the Orca market has remained stable at the $1.6 level since February, with minimal trading volume. It appeared as though the market had entered a prolonged period of inactivity, with the price holding steady at this level for an extended time.
However, on March 21, the market experienced a sudden and significant surge, propelling the price toward the $6.00 mark. This sharp bullish movement in a short period inevitably triggered a substantial price correction. As traders who had held long positions for some time began securing their profits, the market witnessed a widespread profit-taking phase.
The Orca Market Data
- ORCA/USD Price Now: $2.8
- ORCA/USD Market Cap: $1.534 million
- ORCA/USD Circulating Supply: 55.77 million ORCA
- ORCA/USD Total Supply: 99.99 million ORCA
- ORCA/USD CoinMarketCap Ranking: #260
Key Levels
- Resistance: $3.00, $3.50, and $4.00
- Support: $2.00, $1.60, and $1.00.
The Orca Market Through the Lens of Indicators
The $1.60 price level serves as a critical support zone and has played a significant role in the historical price action of the Orca market. Notably, the last major bull run of late last year originated from this level, making it a psychologically important area for traders. This strong bullish sentiment may explain why the recent bearish decline was halted at this support.
The aggressive bullish surge on March 21, while triggering a sharp correction due to widespread profit-taking, has not completely diminished bullish momentum. Instead, a higher support level has emerged at $2.40, reinforcing positive market sentiment.
From this support, the market has initiated another rally. However, selling pressure has resurfaced, as evidenced by the upper shadow on the current bullish candlestick, indicating significant profit-taking activity in today’s trading session. Despite this bearish rejection in the crypto signal, the formation of a higher support level remains a bullish signal, suggesting continued upward potential.
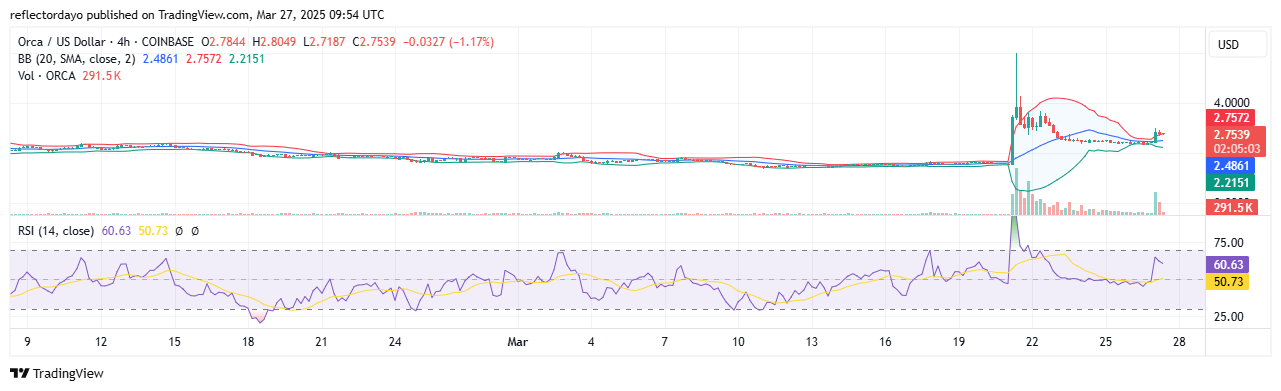
ORCA/USD Price Outlook: 4-Hour Chart Analysis
Initially, the Orca market exhibited high volatility. However, since the emergence of a higher support level at $2.40—which could indicate a standoff between bulls and bears—the Bollinger Bands, which typically reflect market volatility, have converged. This contraction signals a significant decline in volatility, often a precursor to an impending price move.
Following today’s sharp price surge and subsequent correction, bulls have been actively defending the price to maintain stability. However, on the 4-hour chart, price momentum appears to be weakening. This is reflected in the latest candlestick formation, which has transitioned into a four-price doji, indicating market indecision. Additionally, the trade volume histogram has dropped sharply, suggesting reduced trading activity.
Traders should closely monitor this market development, as it could lead to a decisive move in either direction.