Bitcoin (BTC) Price Prediction: BTC/USDT Retreats Below the $57,000 Price Level
Estimated Reading Time: 3 minutes
Don’t invest unless you’re prepared to lose all the money you invest. This is a high-risk investment and you are unlikely to be protected if something goes wrong. Take 2 minutes to learn more

Bitcoin (BTC) Price Prediction: September 11
Price activity in the Bitcoin daily market earlier rebounded off the $53,704 level. Price action progressed upwards past some key marks but soon retreated. As a result, the market seems to be regaining a more bearish outlook.
BTC/USDT Long-term Trend: Bullish (Daily Chart)
Key Price Levels:
Resistance: $60,000, $65,000, $70,000
Support: $55,000, $50,000, $45,000
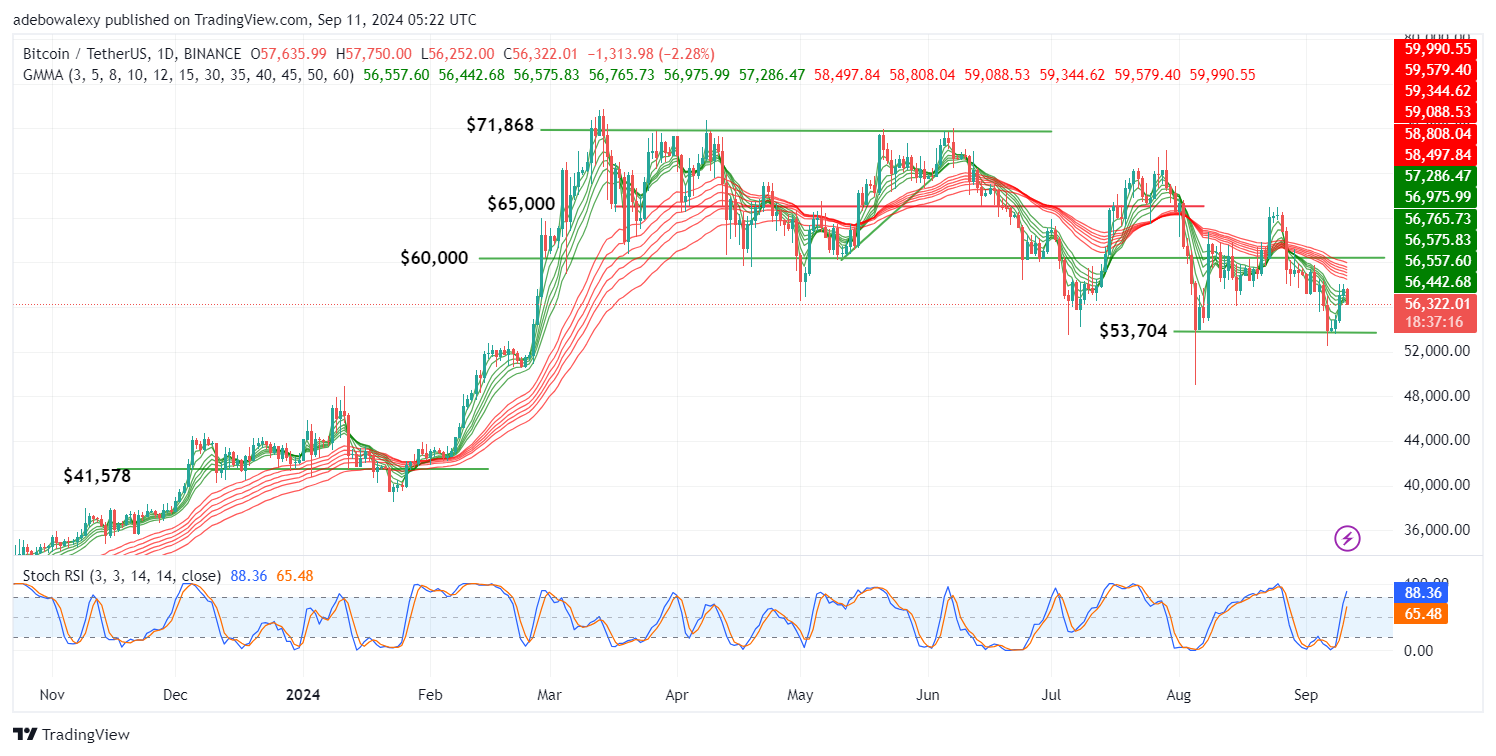
Price activity earlier plunged below the $54,000 threshold but quickly recovered. As a result, price action rose through the green set of the Guppy Multiple Moving Average (GMMA) curves. This restored some bullish hopes in the market as participants may have anticipated a trend continuation. However, the following session resulted in a dip in price, returning the market below the $57,000 level. The Stochastic Relative Strength Index (Stochastic RSI) lines are still rising into the oversold region.
Bitcoin (BTC) Price Prediction: BTC/USDT Bullish Rebound Faces a Challenge
As revealed on Bitcoin’s daily chart, price activity rose upwards throughout the past three sessions. However, the ongoing session has brought a considerable reversal. As a result, Bitcoin now trades below all the GMMA indicator lines. The trajectory of the Stochastic RSI still hints that upside forces are mounting; however, this seems largely like a lagging effect. The current position of price action now suggests that bears may regain control. This suggests that downward forces may cause the market to revisit the support level at the $53,704 threshold.
Bitcoin (BTC) Price Prediction: BTC/USDT Bearish Potential Stays on (4-Hour Chart)
Price movement in the Bitcoin 4-hour market seems to have taken on a more bearish stance. Price action here has been on a steady decline for the past two sessions. The last price candle can be seen plunging further through the GMMA lines. At the same time, the Stochastic RSI lines are slumping towards the 50 mark of the indicator with increasing momentum.
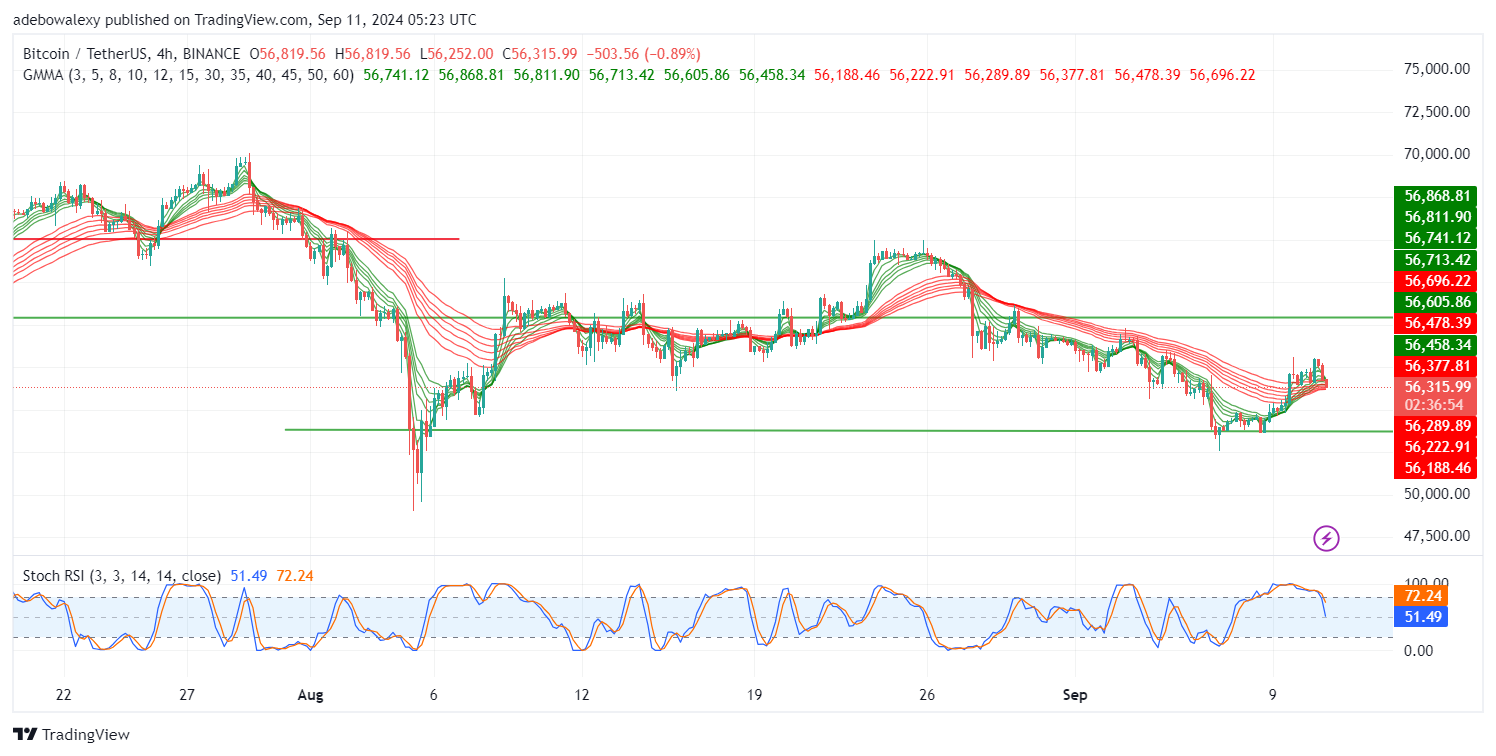
At this point, the market seems set to reach lower price levels, as it appears that headwinds are still in control. Should price action fall below all the GMMA lines on the 4-hour chart, this may signal that price action could breach the support level at the $53,704 mark and test the $50,000 level.