Compound (COMP/USD) Showing Signs of Imminent Reversal
Estimated Reading Time: 3 minutes
Don’t invest unless you’re prepared to lose all the money you invest. This is a high-risk investment and you are unlikely to be protected if something goes wrong. Take 2 minutes to learn more
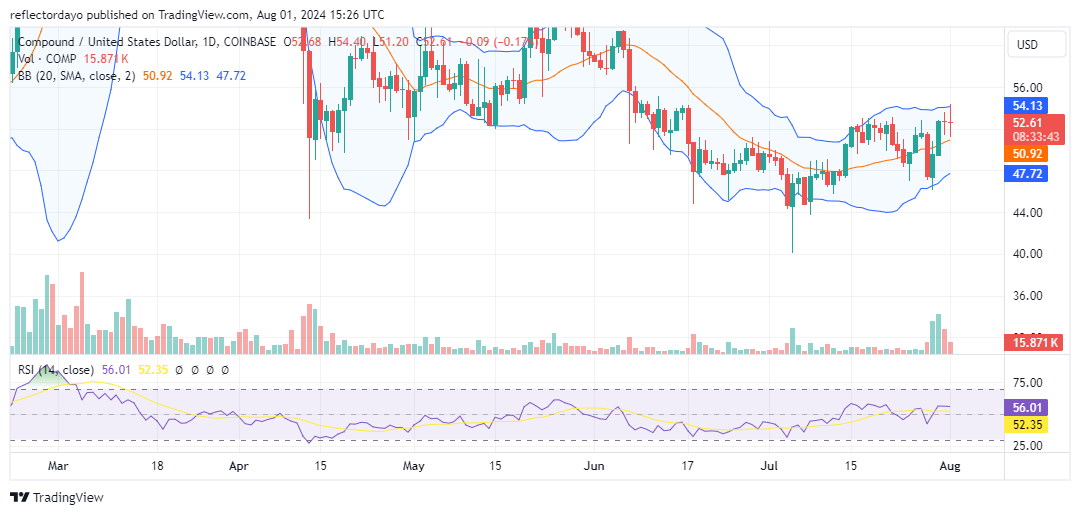
In our most recent analysis of Compound, we noted a remarkable price surge as traders attempted to push for a breakout above the $52.84 resistance level, which has stood since mid-July, limiting the price from advancing toward the $55 level. However, earlier today, the price action tested above this level, reaching $54. Despite this bullish momentum, the price did not sustain above this critical resistance level, and bearish pressure was also rejected at the $51 threshold. This crypto signal indicates the development of a consolidation trend, as bullish and bearish forces are becoming more evenly matched.
COMP Market Data
- COMP/USD Price Now: $52.14
- COMP/USD Market Cap: $437 million
- COMP/USD Circulating Supply: 1.1 billion
- COMP/USD Total Supply: 10 million
- COMP/USD CoinMarketCap Ranking: #136
Key Levels
- Resistance: $54, $56, and $60
- Support: $50, $45, and $40.
Compound Market Through the Lens of Indicators
As bullish and bearish forces become more evenly matched, it suggests that the market may be preparing for a stronger price movement. The market has been volatile on both sides, causing rapid price swings, but neither buyers nor sellers have been able to establish a clear trend.
Considering the trading volume, the volume indicator has shown a decline over the past few trading sessions. This reduction in trading volume also indicates that the market might consolidate around the $52 level, which is becoming a key price point of concern. A sustained breakout above the $52 level remains a catalyst for a renewed bullish trend. Recent short-term breakouts above this level have attracted bullish interest. Therefore, a sustained breakout would likely encourage more traders to adopt a bullish sentiment.
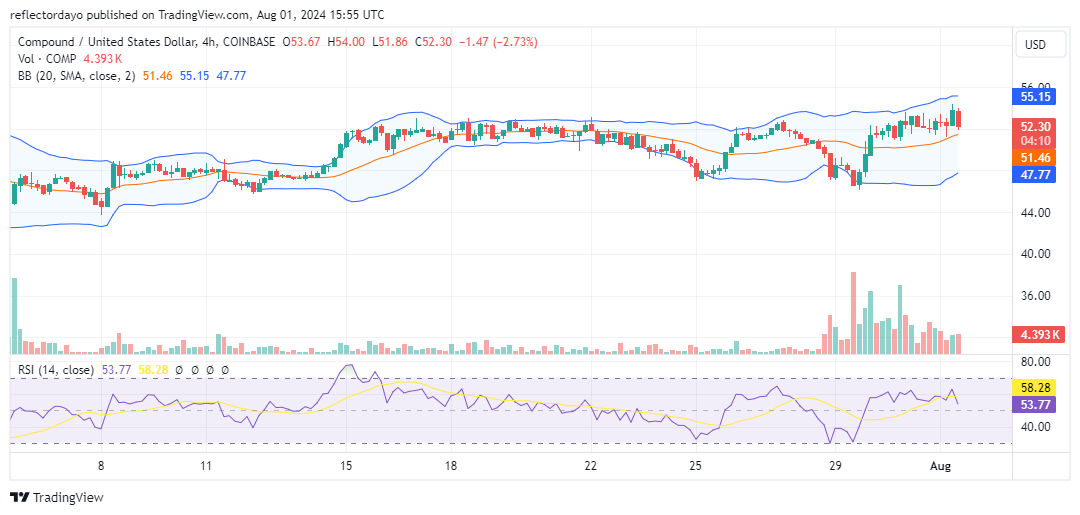
COMP/USD Price Prediction: 4-Hour Chart Analysis
Short-term analysis reveals a battleground around the $52 level, with unsustained surges above this critical point. The previous 4-hour charts, representing recent short-term trading sessions, show several failed upward attempts, evidenced by upper shadow formations. These repeated surges demonstrate Compound’s bullish strength and bearish resilience in preventing a sustained upward movement. Despite these setbacks, bulls have prevented a breakdown below $52, establishing it as a temporary support level. With bulls maintaining a firm grip at the $52 level and limiting declines below this point, the market shows more upward swings, affirming $52 as a strong support level. Decreasing trading volume suggests a potential consolidation phase, and as volatility contracts, a decisive breakout is likely to occur.