Chainlink Falls to $13.42 As Bulls Purchase the Dips
Estimated Reading Time: 2 minutes
Don’t invest unless you’re prepared to lose all the money you invest. This is a high-risk investment and you are unlikely to be protected if something goes wrong. Take 2 minutes to learn more

Chainlink (LINK) Long-Term Analysis: Bullish
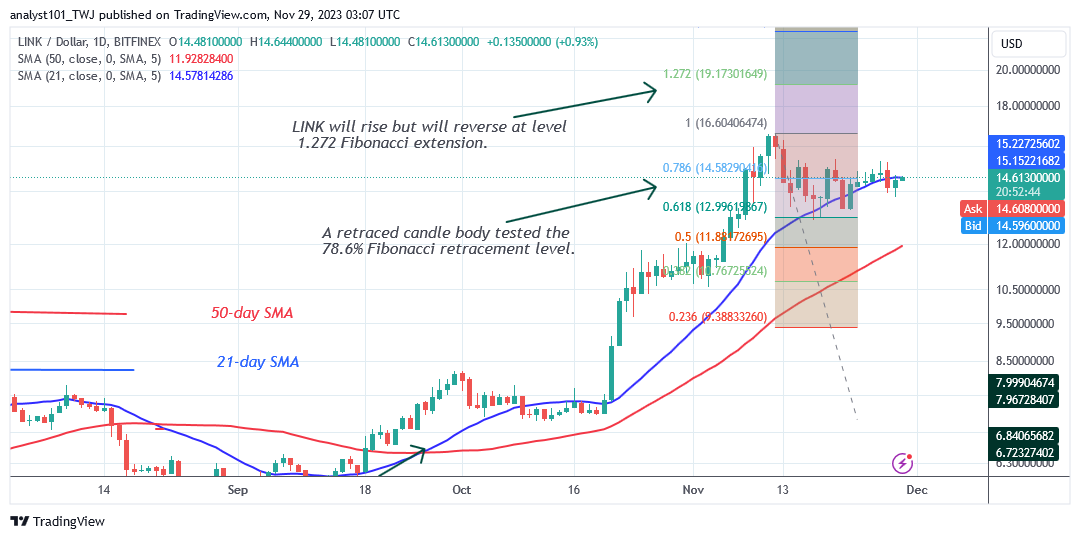
Chainlink (LINK) remains above the 21-day moving average line as bulls purchase the dips. The bulls will purchase the dips whenever the bears breach the 21-day SMA. Bulls purchased the dips on November 27, when the bears broke through the 21-day SMA and hit a low of $13.92. The crypto’s price is rising and approaching the 21-day simple moving average.
On the upside, the horizontal trend will remain above the moving average lines. To retest the resistance, the crypto’s value will rise to $16.58. If the negative trend continues below the 21-day moving average, the price of LINK/USD will fall above the 50-day SMA or $12 support.
Technical indicators:
Major Resistance Levels – $8.00, $10.00, $12.00
Major Support Levels – $6.00, $4.00, $2.00
Chainlink (LINK) Indicator Analysis
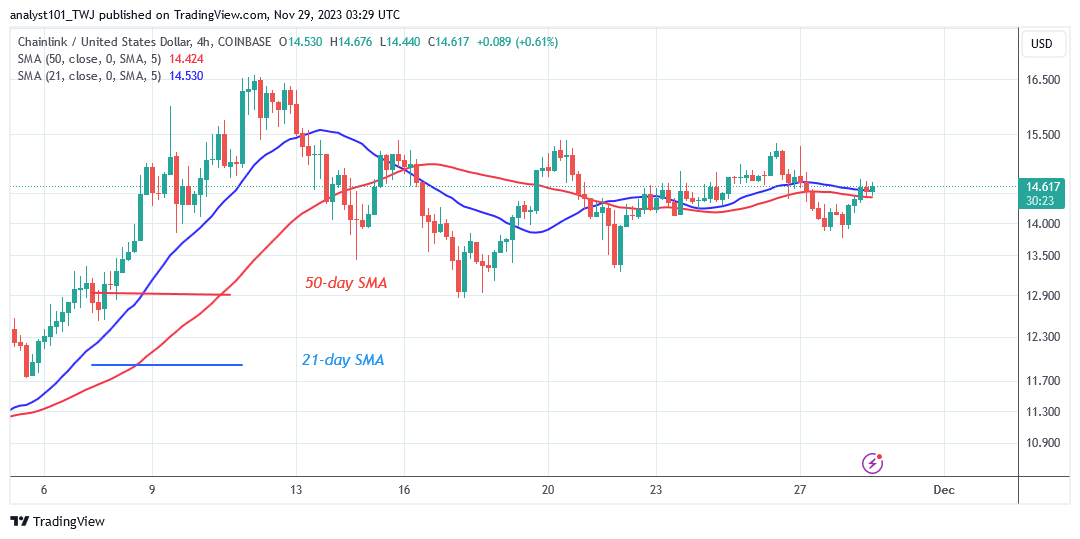
The crypto’s price has been regularly retesting the 21-day SMA as it moves below and above the moving average lines. The bears and bulls are fighting for control of the price above the 21-day SMA. The price bar is currently below the 21-day SMA while rising above the moving average lines.
What Is the Next Direction for Chainlink (LINK)?
Following a recent dip, Chainlink is on the rise as bulls purchase the dips. The upward movement is meeting resistance at the $15.00 high. Price movement is constrained by small body uncertain candlesticks known as Doji candlesticks. The altcoin is currently trading between the price levels of $13.50 and $16.58.
You can purchase crypto coins here. Buy LBLOCK
Note: Cryptosignals.org is not a financial advisor. Do your research before investing your funds in any financial asset or presented product or event. We are not responsible for your investing result