Uniswap (UNI) Price Prediction: UNI/USDT Breaches the $7.00 Threshold
Estimated Reading Time: 3 minutes
Don’t invest unless you’re prepared to lose all the money you invest. This is a high-risk investment and you are unlikely to be protected if something goes wrong. Take 2 minutes to learn more

Date: May 29, 2025
The Uniswap token has now resurfaced above a new psychological price level. The market has been retracing toward this level after taking off near the $6.00 baseline. Since then, the market has maintained an upward trajectory toward the $7.00 mark and is now trading just above this price level.
UNI/USDT Long-Term Trend: Bullish (Daily Chart)
Key Price Levels:
Resistance: $7.50, $8.00, $8.50
Support: $7.00, $6.50, $6.00

The Uniswap market, on the daily price chart, has remained bullish for about five consecutive days. A bullish price candle represents the ongoing session. This candle can be seen testing a breach of the uppermost limit of the Bollinger Bands. However, the price has since contracted below this upper limit. Nevertheless, price action remains above the middle Bollinger Band, and the Smoothed Rate of Change (SROC) indicator line stays above the equilibrium level. The SROC indicator continues to show a general upward trajectory.
Uniswap (UNI) Price Prediction: UNI/USDT Market Stays Positive
The current trend in the Uniswap market is bullish, and price action is proceeding in that direction. As a result, the ongoing session continues to hover around the upper limits of technical indicators. The last price candle on this Uniswap daily chart can be seen piercing the uppermost limit of the Bollinger Bands.
However, downward forces only caused a temporary pullback, and the market remains largely buoyant. The Smoothed Rate of Change (SROC) indicator retains a general upward trajectory above the equilibrium level, indicating that the overall trend in this market remains positive.
Uniswap (UNI) Price Prediction: UNI/USDT Downward Rejection Stays Subdued
What appeared as a contraction on the Uniswap daily chart has been portrayed here as a downward rejection during a session. The last price candle on the token’s 4-hour chart is a red one, which has caused the market to pull back below the uppermost limit of the Bollinger Bands.
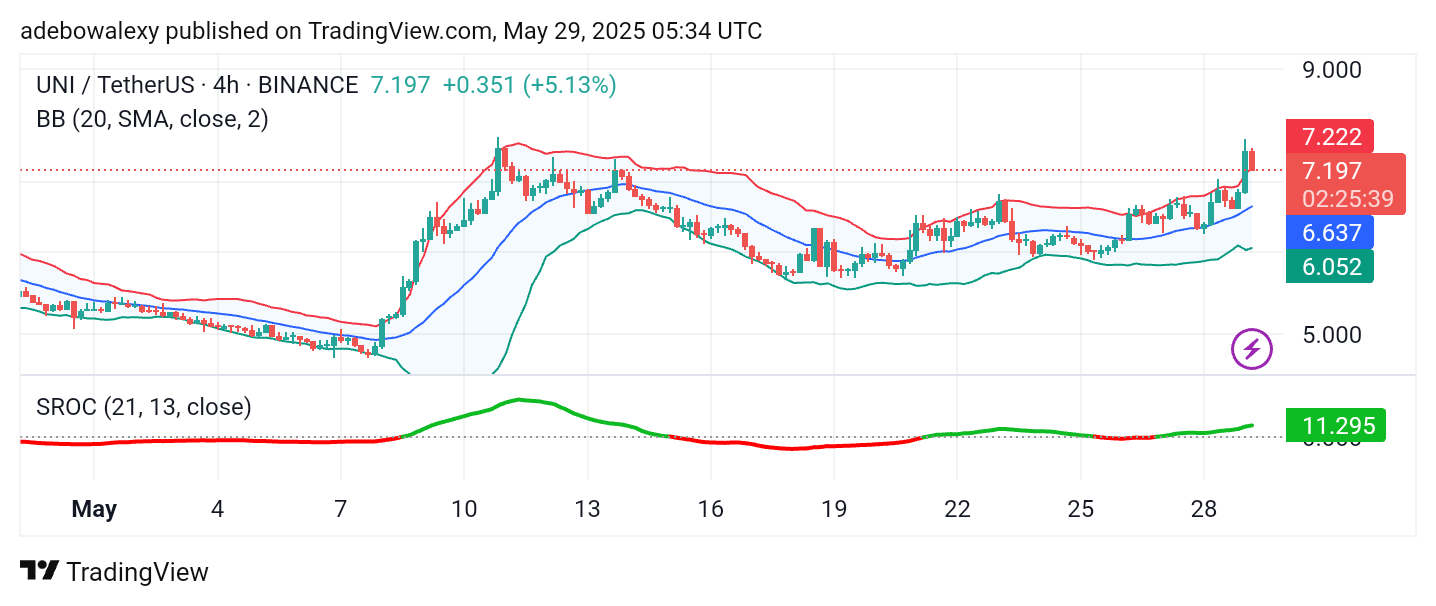
Nevertheless, trading continues above the middle Bollinger Band, maintaining the outlook that the upward correction in this market may still be intact. Also, the SROC indicator remains above the equilibrium level and continues to follow an upward trajectory. Consequently, traders can still target price levels around the $7.50 and $8.00 marks.