Bitcoin Cash (BCH/USD) Market Displays Mounting Downside Pressure Amid Weakening Technical Signals
Estimated Reading Time: 3 minutes
Don’t invest unless you’re prepared to lose all the money you invest. This is a high-risk investment and you are unlikely to be protected if something goes wrong. Take 2 minutes to learn more
BCH Price Prediction — November 26
BCHUSD market displays mounting downside pressure amid weakening technical signals. The BCHUSD pair is currently demonstrating a broad-based loss of momentum, with its daily structure aligning more closely with bearish indicators.
Price action remains capped below the declining trendline, while the 9-period SMA at $524.60 has shifted into a position of overhead resistance. The Stochastic Oscillator is drifting lower from mid-range levels, reinforcing a narrative of diminishing buying strength and increased vulnerability to downside continuation.
BCH/USD Market Key Levels:
Resistance levels: $632.60, $680.00, $719.00
Support levels: $462.00, $423.00 $377.90

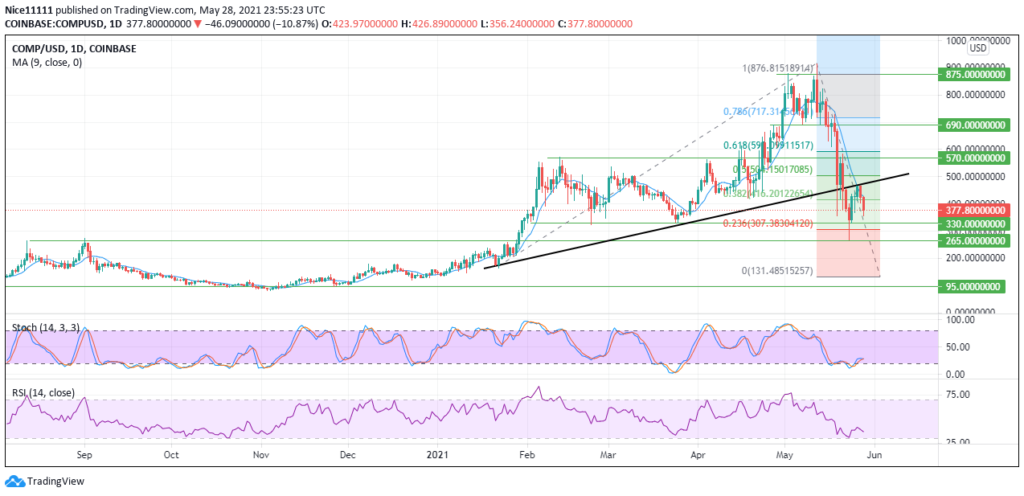
BCH/USD – Daily Chart
The BCH/USD daily chart shows that the market is maintaining its descending structure.
From a technical standpoint, recent attempts to break above the trendline near $550.00–$555.00 were firmly rejected, signaling persistent supply at higher levels. The market also left behind a lower high formation, maintaining the integrity of its descending structure and reaffirming that sellers remain strategically positioned. Subsequent drawdowns have returned prices closer to the $525.00 region, where short-term demand appears insufficient to halt the broader downward trajectory.
Bitcoin Cash is set to remain bearish as key indicators across the lower timeframes continue to signal downside momentum. Price action shows persistent lower lows and lower highs, and BCH is struggling to hold the 0.382 Fibonacci retracement, suggesting weakness rather than a base forming. Momentum indicators such as RSI, stochastics, and MACD all lean bearish, reinforcing the likelihood of continued selling pressure. Until price can reclaim and close above the critical $536 resistance on the 4-hour chart, the trend remains tilted downward, leaving BCH vulnerable to deeper moves toward the $503–$480 support region.
What is the projection for the BCHUSD market?
Looking ahead, a decisive drop below $462.00 would expose the market to deeper retracement toward the key support floor at $423.00, which aligns with the projected bearish expansion. Should this level fail to attract meaningful buy-side interest, the pair may extend toward lower liquidity pockets closer to $378.00. Unless price reclaims and stabilizes above the descending trendline, the prevailing bias is expected to remain skewed toward sustained depreciation.
Bitcoin Cash (BCH) Current Statistics
The current price: $527.70
Market Capitalisation: $10,600,000,000
Trading Volume: $314,240,000
Place winning BCH trades with us. Get BCH here