Rocket Pool (RPL/USD) Seeks Support at $16.00 Amid Downtrend
Estimated Reading Time: 3 minutes
Don’t invest unless you’re prepared to lose all the money you invest. This is a high-risk investment and you are unlikely to be protected if something goes wrong. Take 2 minutes to learn more
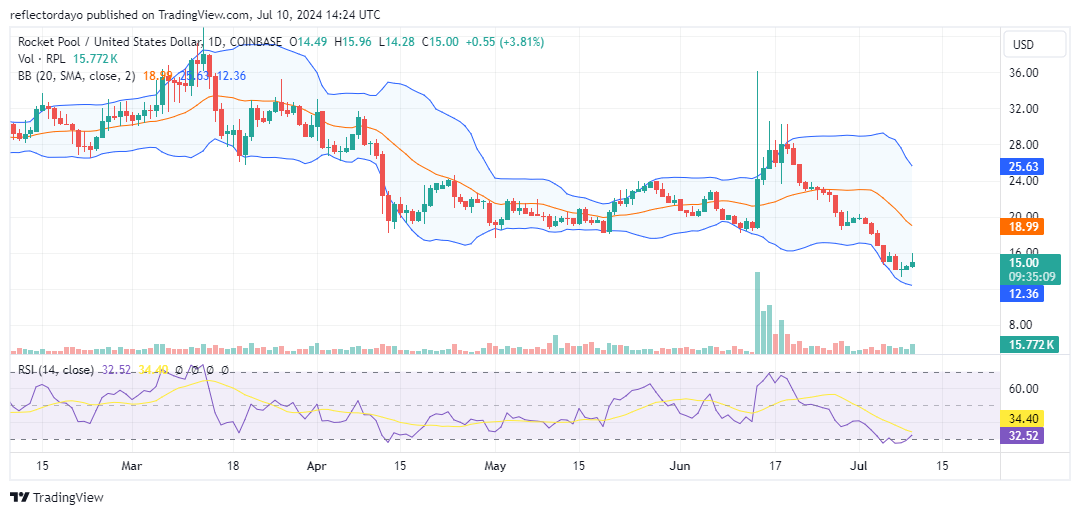
In June, specifically on June 14, Rocket Pool experienced a significant surge in volatility, causing the market to rise sharply from $20 to $36 in a single day. This rapid increase triggered substantial selling activity, which persisted even after reaching the key support level of $20. The selloff continued, breaking through the $16 price level. However, below this critical threshold, the market found a pivot and began to rally, recovering after hitting $14.17.
Rocket Pool Market Data
- RPL/USD Price Now: $6.42
- RPL/USD Market Cap: $1 billion
- RPL/USD Circulating Supply: 196 million
- RPL/USD Total Supply: 1 billion
- RPL/USD CoinMarketCap Ranking: #59
Key Levels
- Resistance: $18.00, $20.00, and $25.00
- Support: $12.00, $11.50, and $11.00.
The Rocket Pool Market Through the Lens of Indicators
Bollinger Bands began indicating bearish activity after the market broke below the $20 price level, a longstanding support level since April. Following this breakdown, the 20-day moving average and the two standard deviation curves shifted from a horizontal to a downward trajectory, signaling a downtrend.
However, on July 8, the market found a pivotal price level and started to rally. Despite this crypto signal, the bullish sentiment appears weak due to low trade volume, suggesting the market lacks vigor. Consequently, the downtrend may continue. Currently, the market is encountering resistance at the $16 price level.
This rally might be a correction caused by the market being oversold, as indicated by the Relative Strength Index. Alternatively, the price action may continue to consolidate and range sideways around the $16 price level.
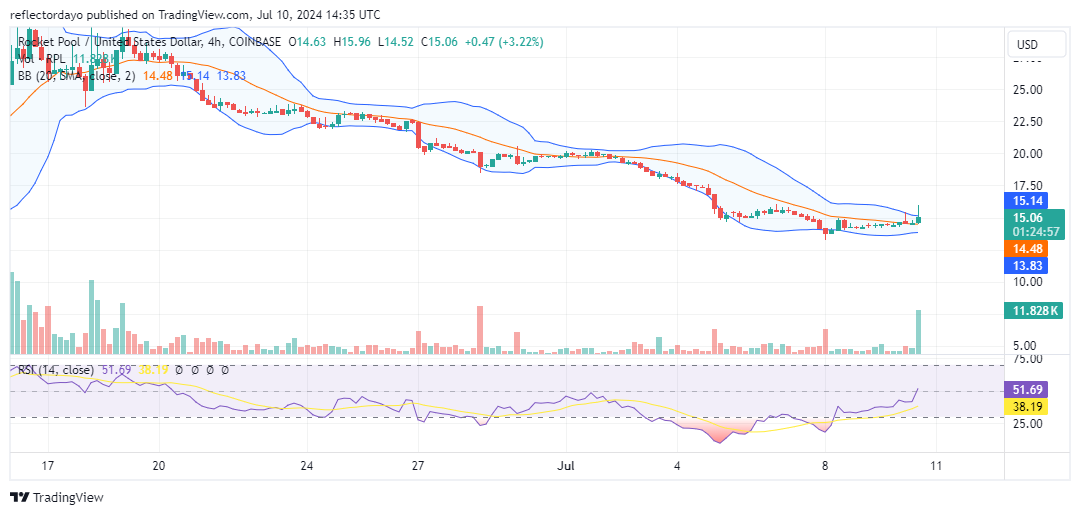
RPL/USD Price Prediction: 4-Hour Chart Analysis
Apart from the fact that the 4-hour chart shows a downward trend in price action, the latest 4-hour chart reveals a falling star candlestick pattern and a significant histogram. This suggests that the bearish trend is likely to continue. The falling star pattern indicates that while the bulls attempted to drive the market upward, they were ultimately overpowered by the sellers. At best, the bulls might see some consolidation around the $14.18 price level.