Orchid (OXT/USD) Bullish Recovery Faces Its First Test
Estimated Reading Time: 3 minutes
Don’t invest unless you’re prepared to lose all the money you invest. This is a high-risk investment and you are unlikely to be protected if something goes wrong. Take 2 minutes to learn more

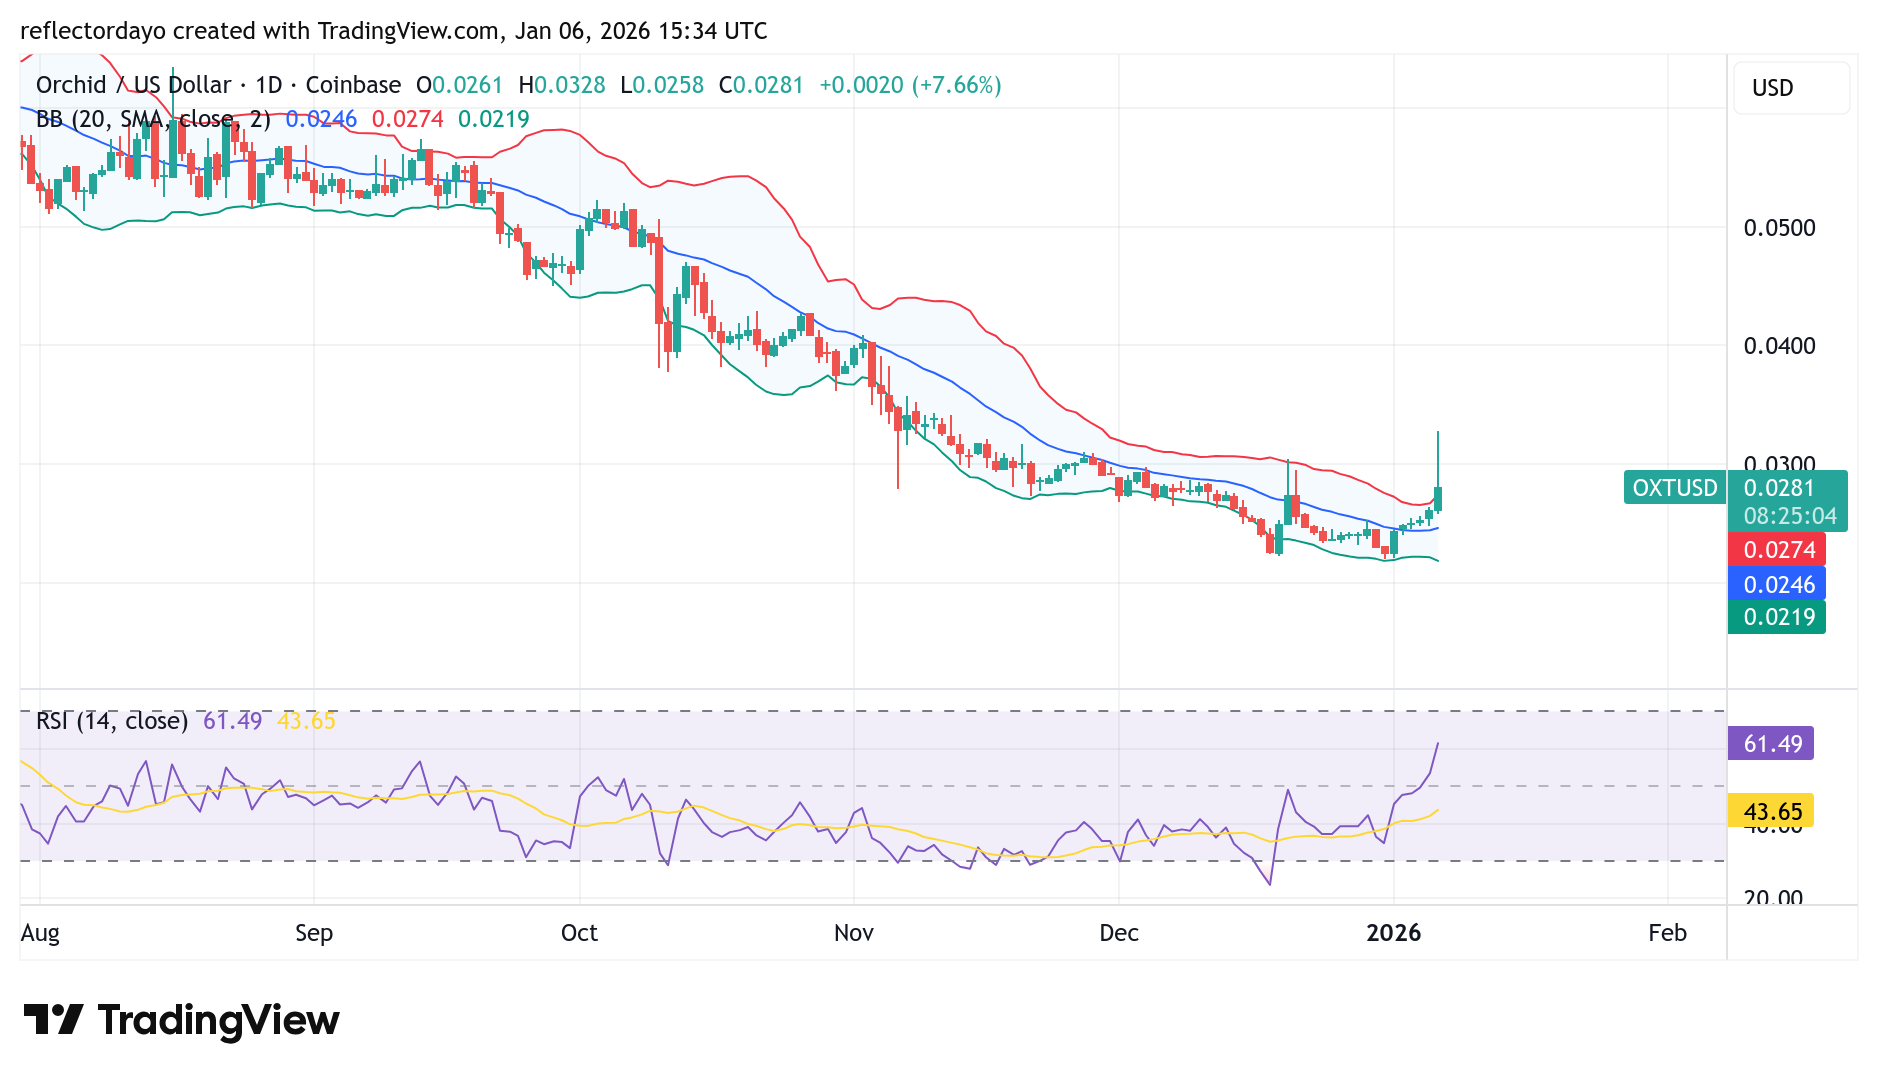
Like much of the broader crypto market in recent weeks, Orchid (OXT/USD) has been trending downward since September, when a bearish move began near the $0.055 price level. This decline persisted until around the Christmas period of 2025, when bullish sentiment started to emerge near the $0.022 level, prompting the market to transition from a downtrend into a consolidation phase.
A bullish recovery has since begun, gaining traction from January 1, as buyers attempt to regain control and challenge the prevailing bearish structure.
Orchid (OXTUSD) Market Data
- OXT/USD Price Now: $0.0281
- OXT/USD Market Capitalization: $28 million
- OXT/USD Circulating Supply: 997 million OXT
- OXT/USD Total Supply: 1 billion OXT
- OXT/USD CoinMarketCap Ranking: #639
Key Levels to Monitor
- Resistance: $0.03, $0.035, $0.04
- Support: $0.02, $0.015, $0.010
Orchid Market Analysis: Technical Viewpoint
Orchid began its bullish recovery on the first day of 2026, rebounding from the $0.022 price level, which has emerged as a pivotal support zone. This level has been strengthening since the Christmas period, consistently rejecting further downside pressure and preventing bears from extending the decline. As the price now approaches a major resistance area near $0.030, upside attempts are being met with rejection as traders turn cautious, with some opting to take profits around this level. A decisive breakout above $0.030 would significantly strengthen the integrity of the ongoing bullish recovery.
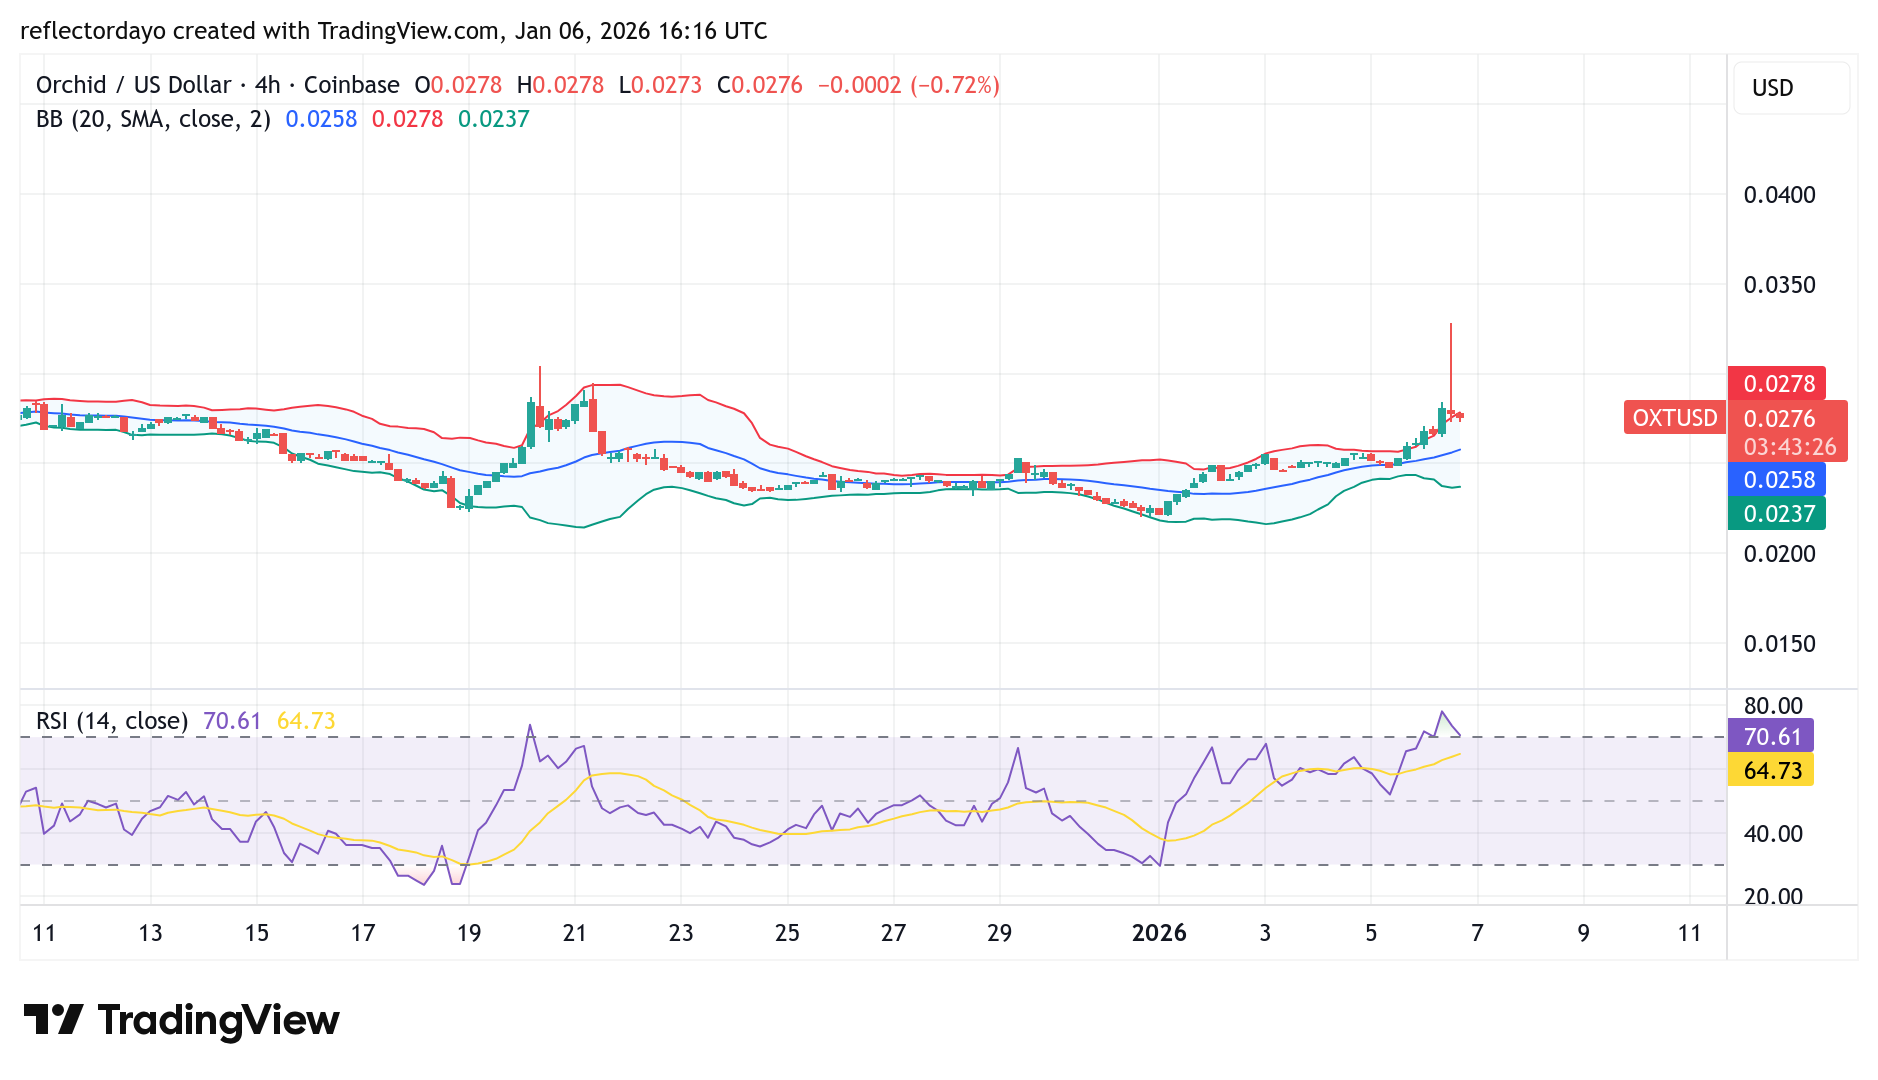
OXTUSD 4-Hour Chart Outlook
Zooming into the 4-hour chart perspective, price action shows demand and supply converging around the $0.028 level, leaving the market largely at a standstill. The two indicators applied in this analysis—the Bollinger Bands and the Relative Strength Index (RSI)—both suggest that the market is currently overbought. If this equilibrium persists, a period of consolidation may develop near the $0.030 level. Traders are closely monitoring this zone, as a breakout here will likely determine whether the bullish recovery can extend further.
$0xUSD connects DeFi yield with real settlement liquidity, deployed across $20B+ in pre-funded routes—turning idle capital into productive liquidity.
$0xUSD connects DeFi yield with real settlement liquidity.
Deployed across $20B+ in pre-funded routes, turning idle capital into productive liquidity.
Built for institutions, optimized for efficiency.
Notifications on 🔔 pic.twitter.com/jU7KHJURHi
— ORBT (@ORBT_Protocol) October 27, 2025