XDC Network (XDC/USD) Bullish Recovery Draws Near $0.055
Estimated Reading Time: 3 minutes
Don’t invest unless you’re prepared to lose all the money you invest. This is a high-risk investment and you are unlikely to be protected if something goes wrong. Take 2 minutes to learn more
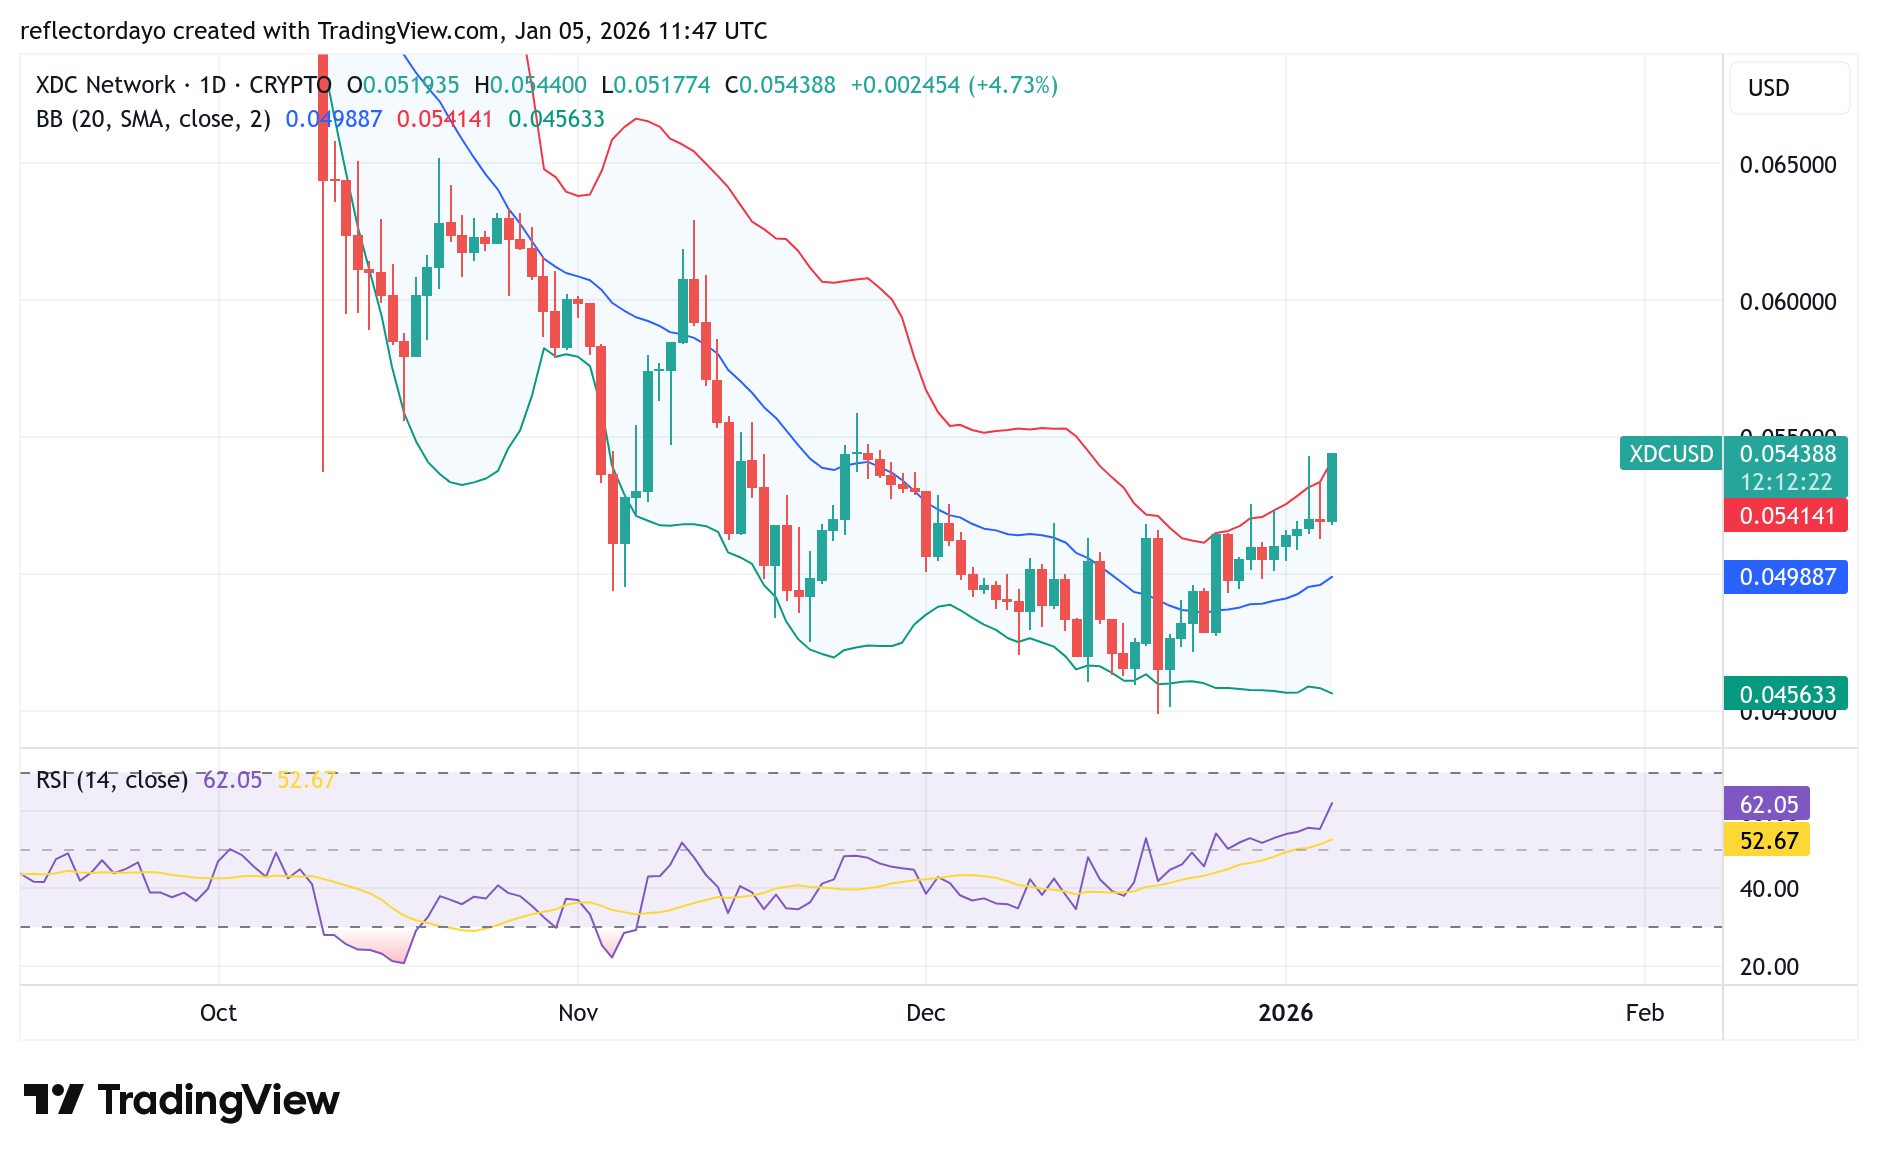
The XDC Network has been sustaining a bullish recovery after forming a pivotal support around the $0.045 price level. This rebound follows a prolonged bearish phase that began in July, when price action started declining from the $0.100 level. Currently, price has broken above the key $0.050 resistance and is now pushing toward the $0.055 region, though upside momentum appears to be temporarily capped near the $0.054 level.
XDC Network (XDC/USD) Market Data
- XDC/USD Price Now: $0.0543
- XDC/USD Market Capitalization: $1 billion
- XDC/USD Circulating Supply: 19 billion XDC
- XDC/USD Total Supply: 38 billion XDC
- XDC/USD CoinMarketCap Ranking: #65
Learn how XinFin (XDC Network) supports enterprise blockchain solutions using a hybrid consensus system, and explore the real-world use cases of the XDC token.
Key Levels to Monitor
- Resistance: $0.055, $0.060, $0.065
- Support: $0.050, $0.045, $0.040
XDC Network Market Analysis: Technical Viewpoint
According to the indicators, the Bollinger Bands illustrate that price action has shifted to the upside after reaching a pivotal support at the $0.045 level, with price surging above the 20-day moving average. So far in today’s trading session, XDC Network bulls have maintained clear control, as reflected by the formation of a Marubozu candlestick, which signals strong buying pressure. However, despite today’s bullish dominance, the crypto market remains within a broader long-term downtrend, meaning buyers will need to deliver stronger follow-through to confirm a sustainable recovery. A decisive break above the $0.055 price level would likely attract further bullish interest.
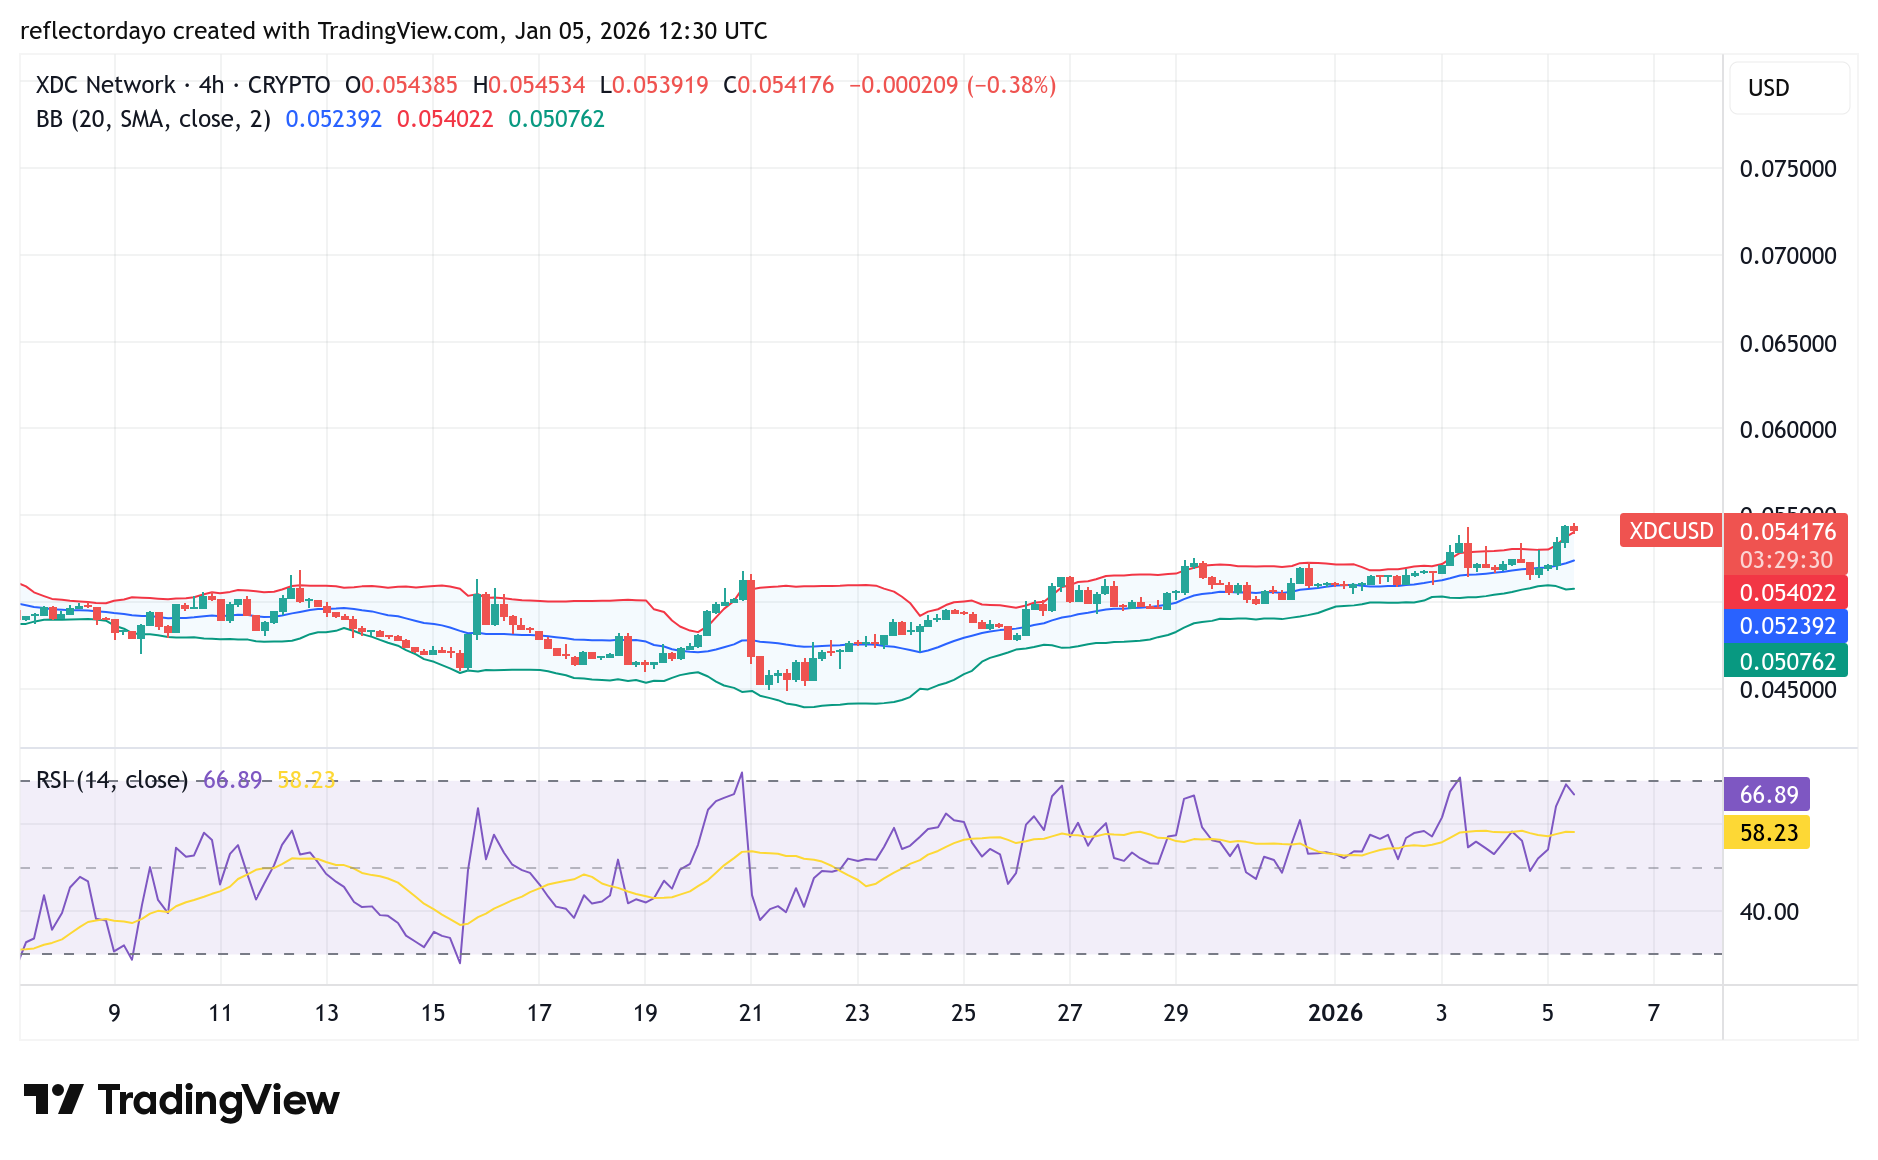
XDC/USD 4-Hour Chart Outlook
From the 4-hour chart perspective, price action is gradually gaining upward traction. While momentum remains modest, it reflects growing buying interest as traders begin to re-enter the market. The current 4-hour chart shows a Doji candlestick forming near the $0.05467 level, effectively capping the ongoing advance. A decisive breakout above this zone is critical for the continuation of the bullish recovery. Failure to clear this resistance could lead to either a period of consolidation or a renewed downside move, especially considering that bears have dominated the market for an extended period.
Broadcasting from the iconic @NYSE, @atulkhekade, Co-Founder of @XDCNetwork, joins @FintechTvGlobal to discuss the real-world convergence of TradFi and DeFi.
Broadcasting from the iconic @NYSE , @atulkhekade , Co-Founder of @XDCNetwork , joined @FintechTvGlobal to discuss how TradFi and DeFi are converging in the real world.
From trade finance and tokenization to ISO-compliant, enterprise-ready blockchain infrastructure, XDC’s… pic.twitter.com/r6ftrOcv81
— XDC Network (@XDCNetwork) January 1, 2026