Solana (SOL/USD) Market Holds in Lower Range Trading Zones
Estimated Reading Time: 3 minutes
Don’t invest unless you’re prepared to lose all the money you invest. This is a high-risk investment and you are unlikely to be protected if something goes wrong. Take 2 minutes to learn more

Free Crypto Signals Channel
Solana Price Prediction – October 7
There has been a continual process of price featuring ups and downs in the SOL/USD market operations over time in a smaller length as the crypto market holds in lower range trading zones. The overall trading point of view shows price has been slowly moving between a high and a low of $33.76 and $32.43 value lines in the last several hours of today’s activities at an average percentage rate of 1.14% negative.
SOL/USD Market
Key Levels:
Resistance levels: $40, $45, $50
Support levels: $30, $25, $20
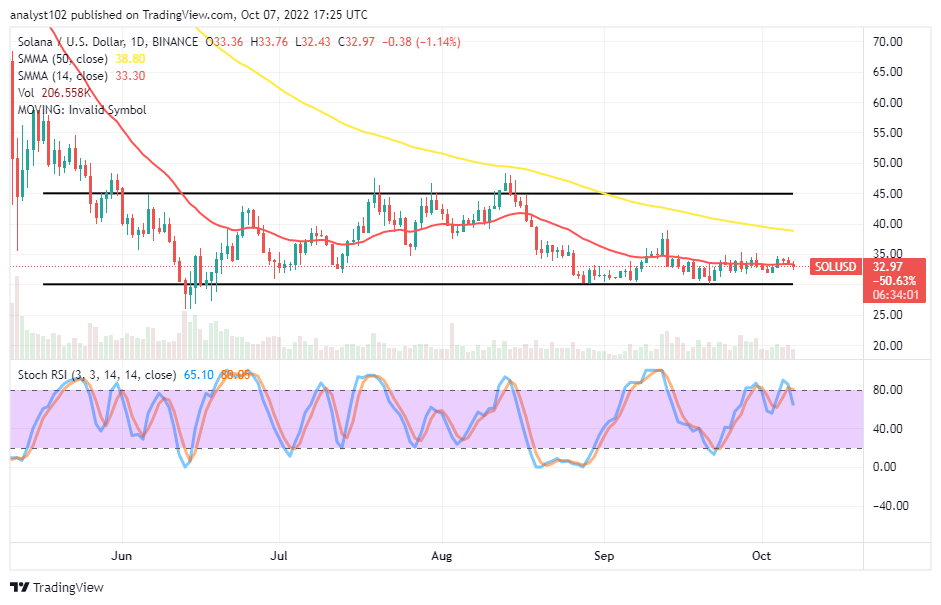
SOL/USD – Daily Chart
The daily chart showcases the SOL/USD market holds in lower-range trading zones around the trend line of the smaller SMA over a couple of sessions. The 50-day SMA indicator is at a $38.80 value line, above the $33.30 point of the 14-day SMA indicator. Variant candlesticks have been in the range-bound spots of $35 and $30. The Stochastic Oscillators are seemingly attempting to cross southbound at 80.05 and 65.10 range points to indicate a declining motion is imminent.
Will there be a re0occurrence of depressive moves below the SOL/USD market at $35 soon?
The SOL/USD market will likely decline underneath the $35 level as the price holds lower-range trading zones. If that technical analysis assumption is anything to go by, long-position placers need to be cautious of exerting a buying order at this moment. They may need to allow the price shifts down to find support around its previous lower-range trading spot of around $30. A sudden breakdown of the value line for sustainability tends not to occur under the current trading setup.
On the downside of the technical analysis, It may not be the ripe time for the sellers to exert a selling order when the market is making a low-active move to the downside of the 14-day SMA. The reason for that sentiment has been that the force’s tendency to back such a move around that trading point appears unreliable to keep it long-featuring to break through some support levels in a continuation moving mode afterward.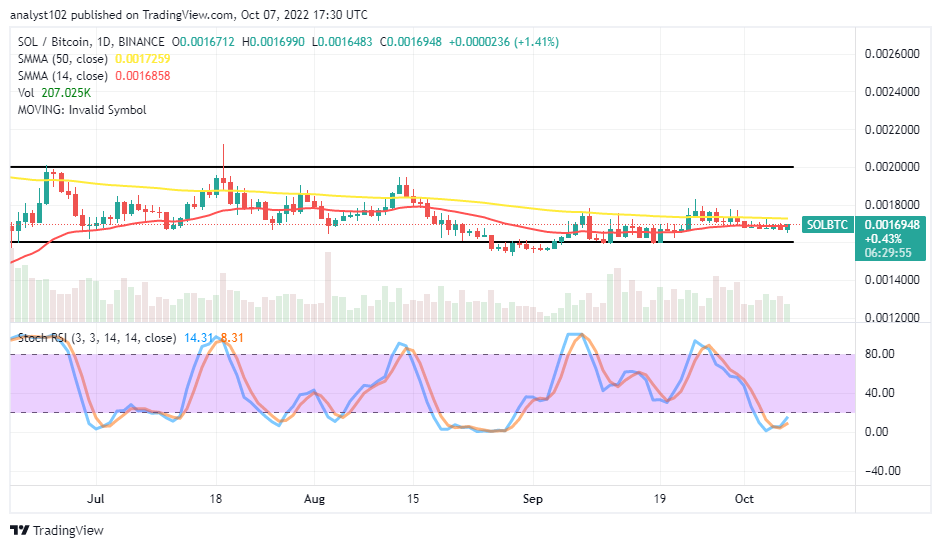
SOL/BTC Price Analysis
Solana appears, shifting in its trending capacity to a baseline around a high-trading range spot that involves the trend lines of the SMAs. In other words, the cryptocurrency pair price holds in lower trading zones. And the price may soon surge upward to regain some points within the range-bound spots. The 14-day SMA indicator is closely underneath the 50-day SMA indicator. The Stochastic Oscillators have dipped into the oversold region, trying to make a cross back to the northbound at 8.31 and 14.31 range values to indicate the base crypto has a greater chance of going hiking against its counter crypto.
Note: Cryptosignals.org is not a financial advisor. Do your research before investing your funds in any financial asset or presented product or event. We are not responsible for your investing results.
You can purchase Lucky Block here. Buy LBLOCK