Cardano (ADA) Breaks $1.70 Support, Resumes Selling Pressure
Estimated Reading Time: 2 minutes
Don’t invest unless you’re prepared to lose all the money you invest. This is a high-risk investment and you are unlikely to be protected if something goes wrong. Take 2 minutes to learn more
Cardano (ADA) Long-Term Analysis: Bearish
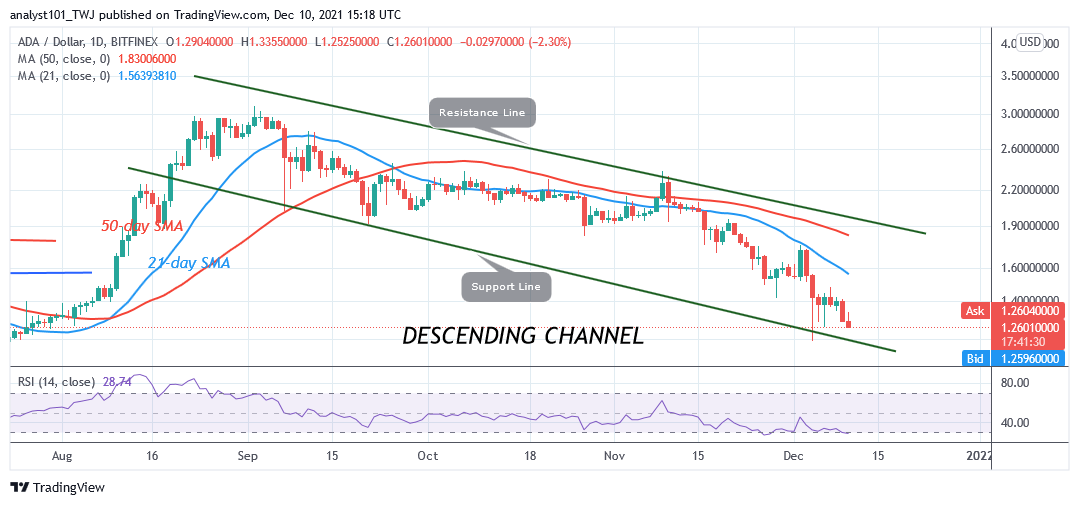
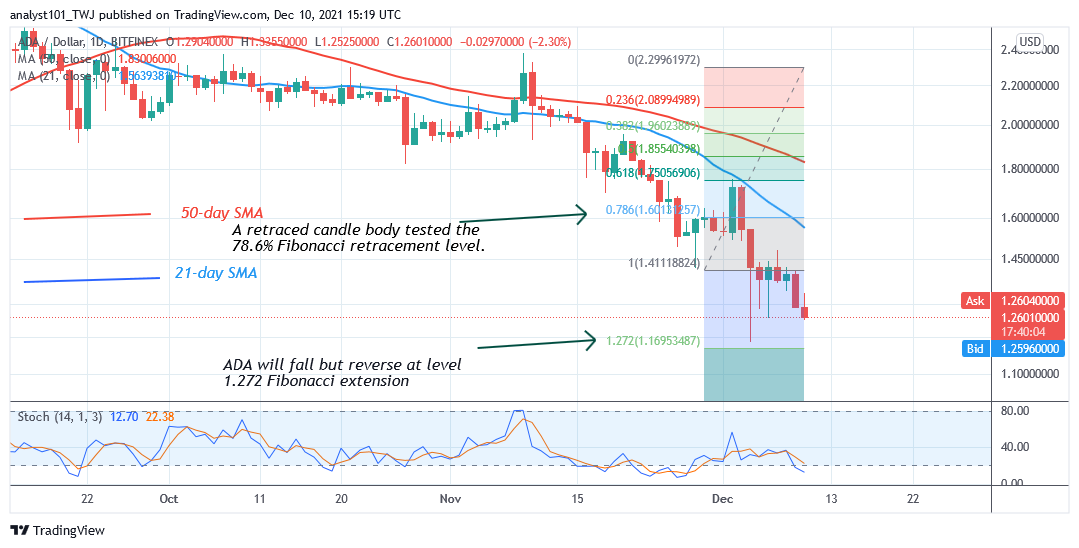
Cardano’s (ADA) price is in a downward move. Today, the selling pressure has resumed as price breaks below the current support at a level of $1.70. This current downtrend is the continuation of the December 4 bearish impulse. During the breakdown, ADA’s price reached a low of $1.18. Today, ADA/USD is trading at $1.26 at the time of writing. If the current selling pressure persists, the market will decline to the previous low at $1,18. On the other hand if price rebounds above the current support, it will signal the resumption of an uptrend.
Cardano (ADA) Indicator Analysis Cardano has fallen to level 28 of the Relative Strength Index for period 14. This indicates that the market has reached the oversold region of the market. The selling pressure ought to reach the bearish exhaustion. We expect buyers to emerge in the oversold region of the market. The crypto’s prices are below the moving averages indicating the downtrend. ADA has fallen below 20% area of the daily Stochastic. It also indicates the oversold condition.
Technical indicators:
Major supply zones: $2.0, $2.20, $2.40
Major demand zones: $1.40, $1.20, $1.00
What Is the Next Direction for Cardano (ADA)?
Cardano has resumed a downward move as price breaks below the current support. Meanwhile, on September 29 downtrend; a retraced candle body tested the 78.6% Fibonacci retracement level. The retracement indicates that Cardano will fall to level 1.272 Fibonacci extension or $1.16. From the price action, the market has reached a low of $1.25.
You can purchase crypto coins here. Buy Token
Note: Cryptosignals.org is not a financial advisor. Do your research before investing your funds in any financial asset or presented product or event. We are not responsible for your investing results