Cardano (ADA/USDT) Poises for More Upside Correction Amid Overbought Signal
Estimated Reading Time: 3 minutes
Don’t invest unless you’re prepared to lose all the money you invest. This is a high-risk investment and you are unlikely to be protected if something goes wrong. Take 2 minutes to learn more
Cardano Long-term Analysis: Bullish
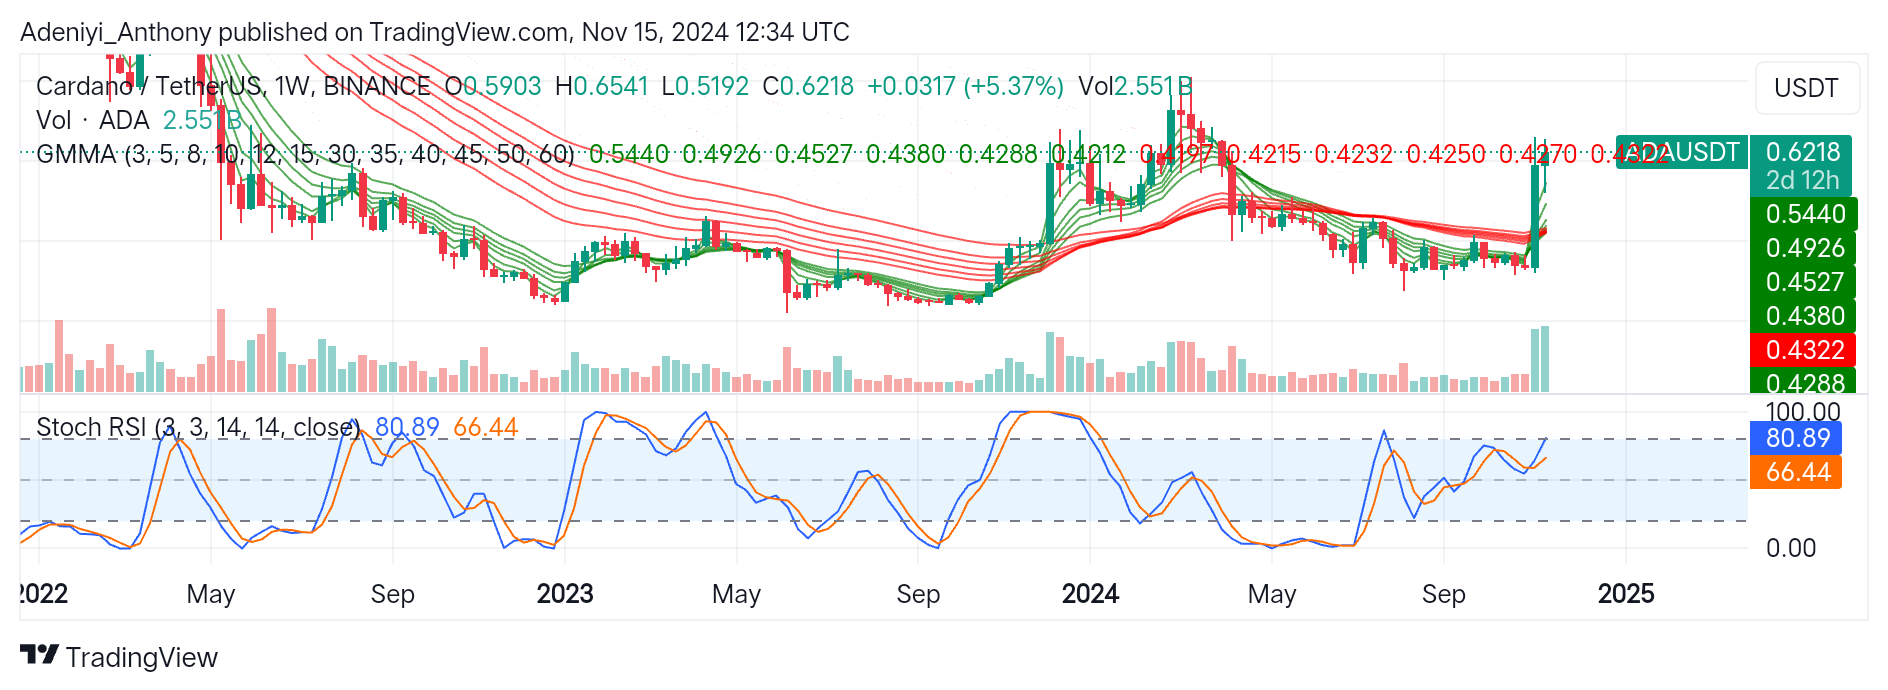
Cardano in 2023 was in a downtrend, with prices consistently forming lower lows below the Guppy Multiple Moving Averages (GMMA) lines. However, Cardano against the Tether in recent weeks has seen a strong upside movement. This suggests a potential shift to an uptrend as ADA broke above the sets of moving averages.
In recent weeks, ADA has shown significant bullish momentum, with a strong increase of 5.37% and 2.551 billion traded volumes. This upside movement is supported by the Stochastic RSI, which indicates the pair operates in the overbought region. However, traders need to watch out for the line crossover, as this may be a temporary peak and the possibility of a short-term retracement looms.
Currently, ADA/USDT trades at $0.6218 above the sets of moving averages with strong weekly traded volumes.
Technical Indicator
Major Resistance Levels: $0.6300, $0.6541, and $0.7000
Major Support Levels: $0.4226, $0.4527, and $0.4288
Cardano Technical Analysis
Cardano on a weekly timeframe has been experiencing a bullish sentiment with the price operating above the GMMA. The recent breakout above the red and green GMMA lines indicates the presence of bullish traders in the market. This reflects the broader crypto market bull season. However, for more upside movement above $0.6218 towards $0.7000, the current momentum must be sustained.
Also, the Stochastic RSI suggests the pair is overbought, with the blue and orange lines reading 80.89 and 66.44, respectively. Though there might still be room for more improvement, the possibility of a short-term pullback cannot be ruled out. Cardano may experience a pullback to $0.5440 if the price fails to hold at $0.6218.
ADA/USDT Analysis: An Upside Correction or a Potential Short-term Pullback
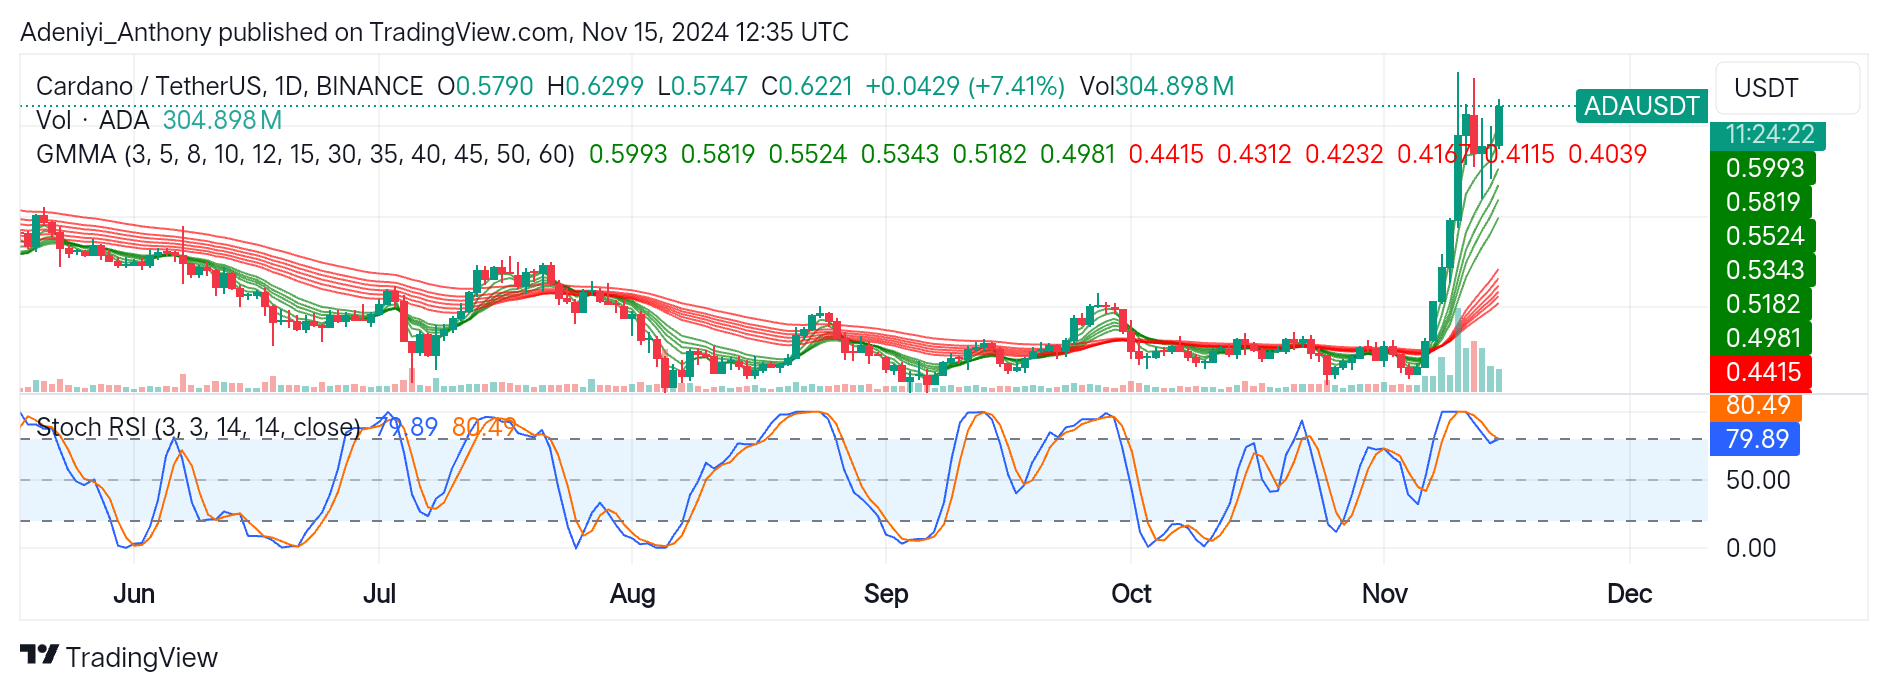
ADA/USDT analysis on a daily timeframe has shown a strong rally over and above the GMMA at $0.5993, with the price at $0.6221. However, ADA, as pictured by the Stochastic oscillator, seems to be preparing for more uptrend or a pullback after a touchdown at the 80.49 level with a potential crossover.
To this end, given the strong rally and the overbought Stochastic condition, ADA may be due for consolidation or a pullback to the $0.5747 level. However, with sustained momentum at the current level and the 304.898 million traded volumes, ADA/USDT may hit the $0.6500 level and beyond.
You can purchase crypto coins here. Buy LBlock