Cardano Revisits Previous Low at $0.41 as It Regains Bullish Momentum
Estimated Reading Time: 2 minutes
Don’t invest unless you’re prepared to lose all the money you invest. This is a high-risk investment and you are unlikely to be protected if something goes wrong. Take 2 minutes to learn more

Free Crypto Signals Channel
Cardano (ADA) Long-Term Analysis: Bearish
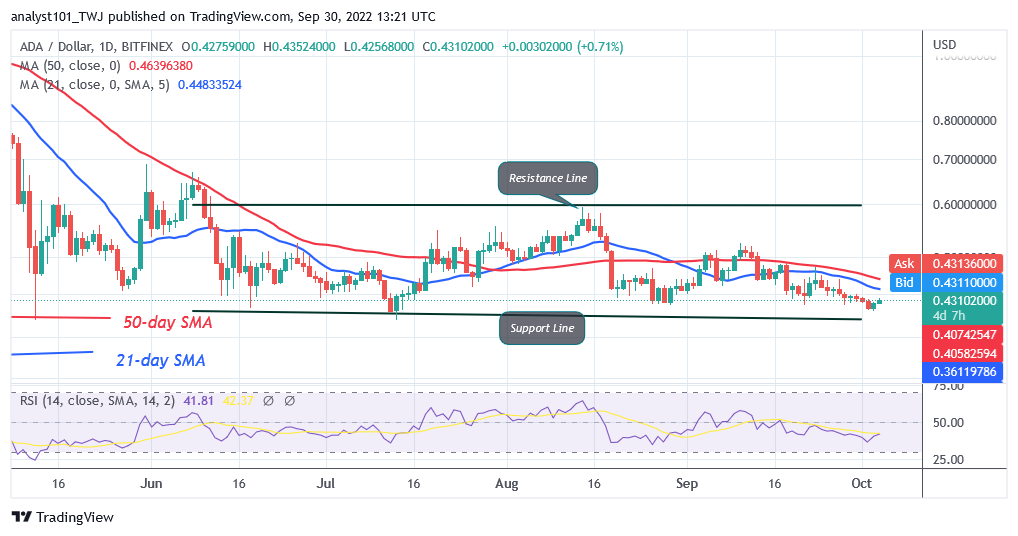
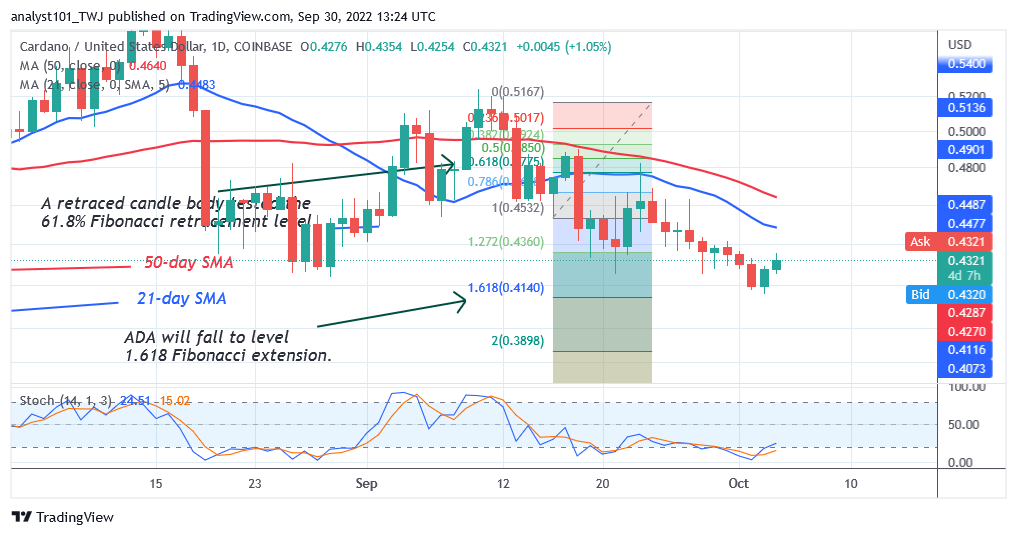
Today, Cardano’s (ADA) price is rising as it regains bullish momentum . The cryptocurrency has declined to the previous low of July 12 . Since September 18, the upward moves have been restrained by the 21-day line SMA. For instance, on September 23, buyers were repelled as Cardano failed to break above the 21-day line SMA. A break above the 21-day line SMA will propel ADA to rally above the 50-day line SMA. Subsequently, it will revisit the overhead resistance at $0.59. Meanwhile, the current support is holding as Cardano resumes its sideways move.
Cardano (ADA) Indicator Analysis
Cardano’s upward correction has pushed the RSI period for 14 to level 42. The altcoin is in the downtrend zone and capable of declining. The moving average lines have remained horizontal as the sideways trend persists. The cryptocurrency is trading in the oversold region below the 20% range of the daily stochastic. Buyers are likely to be attracted to the lower levels of price
Technical indicators:
Major supply zones: $1.0, $1..05, $1.10
Major demand zones: $0.45, $0.40, $0.35
What Is the Next Direction for Cardano (ADA)?
Cardano selling pressure has reached bearish exhaustion as it regains bullish momentum. On September 16 downtrend, ADA price corrected upward and the candle body tested the 61.8% Fibonacci retracement level. The correction suggests that ADA will fall to level 1.618 Fibonacci extension or $0.41.
You can purchase crypto coins here. Buy LBLOCK
Note: Cryptosignals.org is not a financial advisor. Do your research before investing your funds in any financial asset or presented product or event. We are not responsible for your investing results