Cardano Trades in a Tight Range as It Revisits the $0.40 Low
Estimated Reading Time: 2 minutes
Don’t invest unless you’re prepared to lose all the money you invest. This is a high-risk investment and you are unlikely to be protected if something goes wrong. Take 2 minutes to learn more

Free Crypto Signals Channel
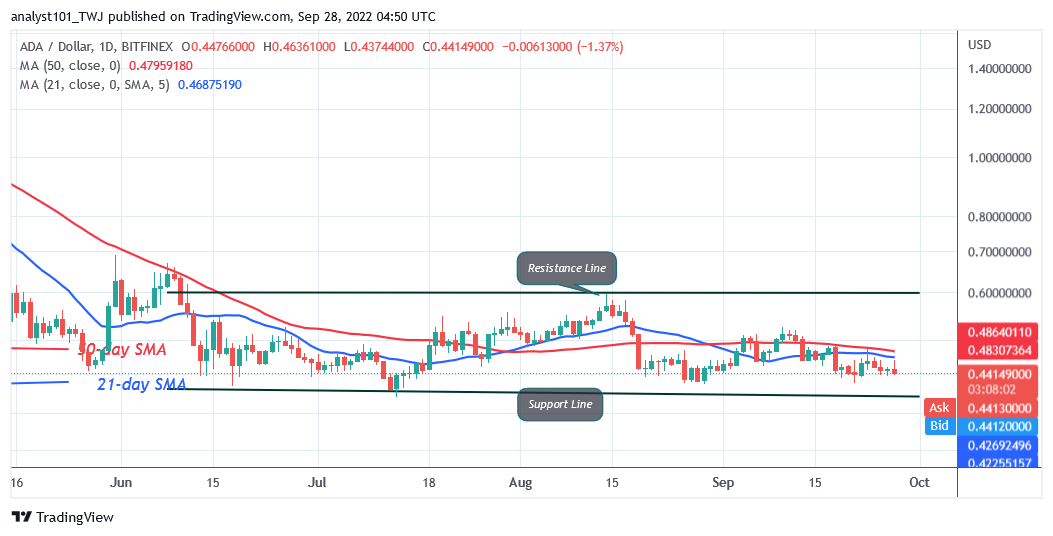
Cardano (ADA) Long-Term Analysis: Bearish
Cardano’s (ADA) price is in a downtrend as it revisits the $0.40 low. On September 23, buyers attempted to break above the moving average lines but were resisted. Since September 18, the upward moves by buyers are being restricted by the 21-day line AMA. Cardano has been trading in a tight range between $0.40 and $0.47 price levels. Sellers will attempt to sink the price below the support at $0.40. ADA/USD has been range bound between $0.40 and $0.60 price levels in the previous price action. A break below the $0.40 support will cause the altcoin to decline to lows of $0.33 and then $0.28.
Cardano (ADA) Indicator Analysis
The crypto is at level 39 of the Relative Strength Index for period 14. It is in the downtrend zone and may further decline. Cardano is below the 20% range of the daily stochastic. ADA/USD has reached the oversold region of the market. The selling pressure has reached bearish exhaustion The moving average lines are sloping horizontally indicating a sideways trend.
Technical indicators:
Major supply zones: $1.0, $1..05, $1.10
Major demand zones: $0.45, $0.40, $0.35
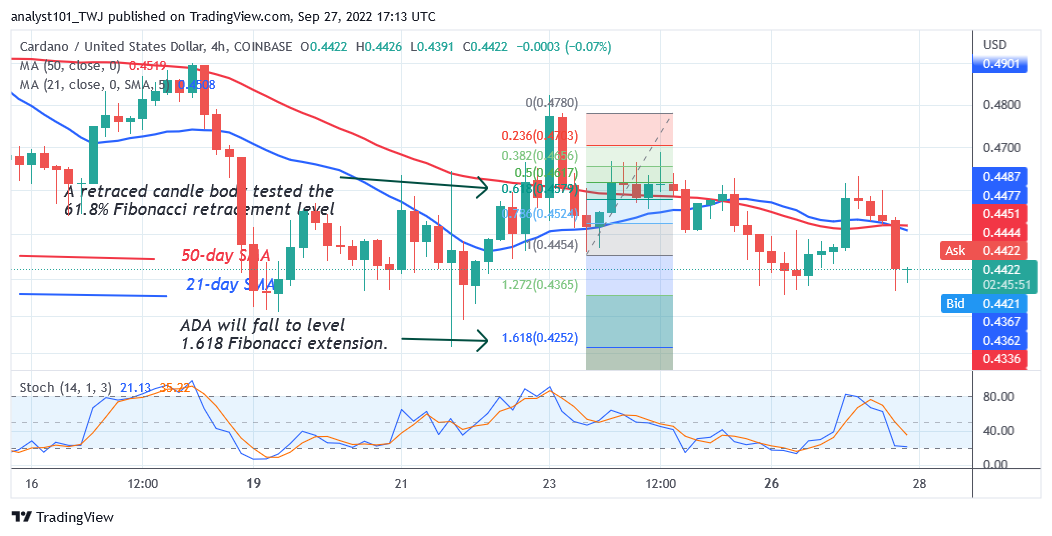
What Is the Next Direction for Cardano (ADA)?
On the 4 –hour chart, Cardano’s price is in a downward move as it revisits the $0.40 low. Meanwhile, on September 33 downtrend, a retraced candle body tested the 61.8% Fibonacci retracement level. The retracement suggests that ADA will fall to level 1.618 Fibonacci extension or $0.42.
You can purchase crypto coins here. Buy LBLOCK
Note: Cryptosignals.org is not a financial advisor. Do your research before investing your funds in any financial asset or presented product or event. We are not responsible for your investing results