Arbitrum (ARB) Seeks Higher Ground After Volatile Stretch
Estimated Reading Time: 3 minutes
Don’t invest unless you’re prepared to lose all the money you invest. This is a high-risk investment and you are unlikely to be protected if something goes wrong. Take 2 minutes to learn more
Arbitrum (ARB) Technical Analysis – June 19
Arbitrum (ARB) is priced at $0.8115, reflecting a promising 4.96% surge over the past day. After opening at $0.7957, ARB has demonstrated resilience by climbing 2.08%.
However, this uptick comes amidst significant volatility, with ARB’s 30-day price range showcasing a concerning 35.98% drop from its peak and an 18.31% decline from its 7-day high.
Dissecting the Charts
Examining the 1-day chart, the Bollinger Bands reveal a wide range of price volatility. The upper band sits at $1.1962, the middle band at $0.9882, and the lower band at $0.7802. ARB’s current price hovering near the middle band suggests potential for further price movement in either direction.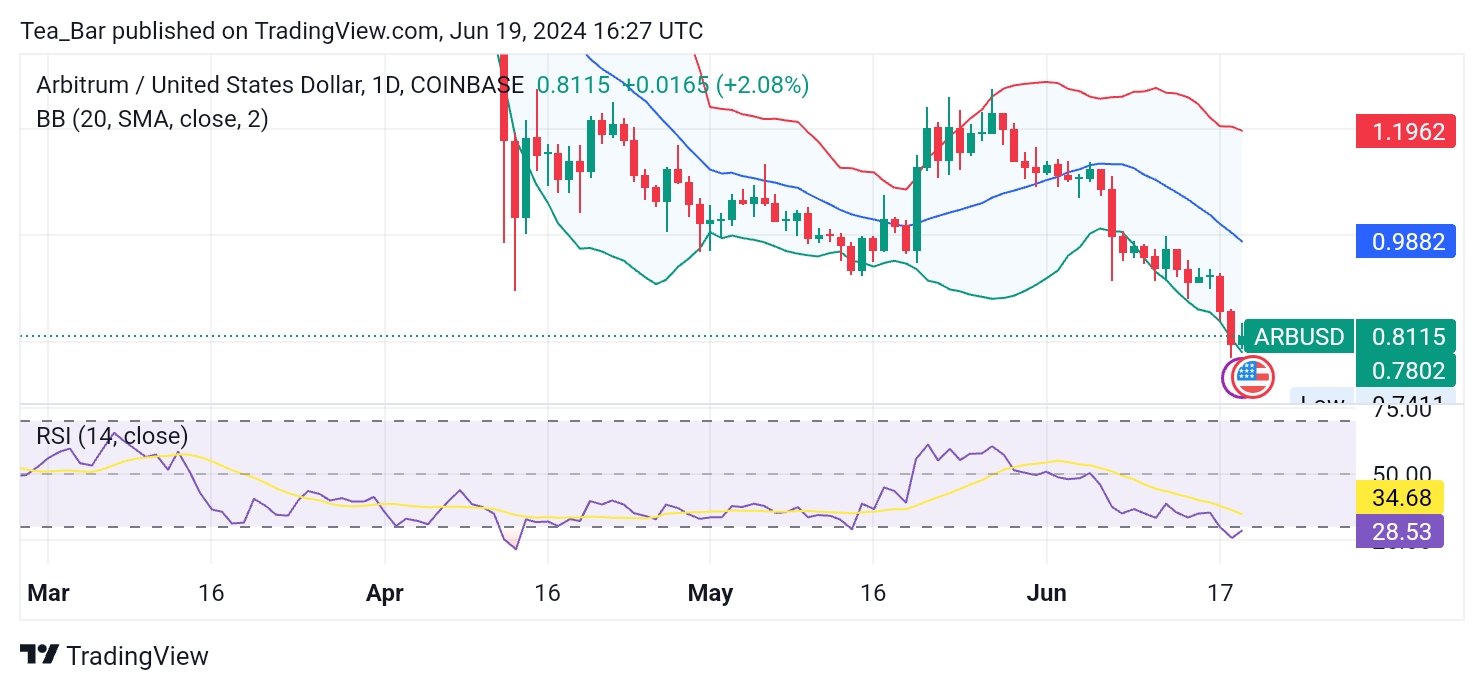
The daily RSI rests at 28, signifying oversold territory. This typically indicates a possible price rebound as buying pressure might increase.
4-Hour Chart
Shifting to the 4-hour chart, the Bollinger Bands paint a slightly different picture. Here, the upper band is at $0.9435, the middle band at $0.8424, and the lower band sits at $0.7412. These narrower bands suggest reduced volatility compared to the daily chart, potentially signaling a period of consolidation or a breakout.
The 4-hour RSI aligns with the daily RSI at 32, indicating moderately oversold conditions. This reinforces the possibility of buying opportunities arising as the market stabilizes.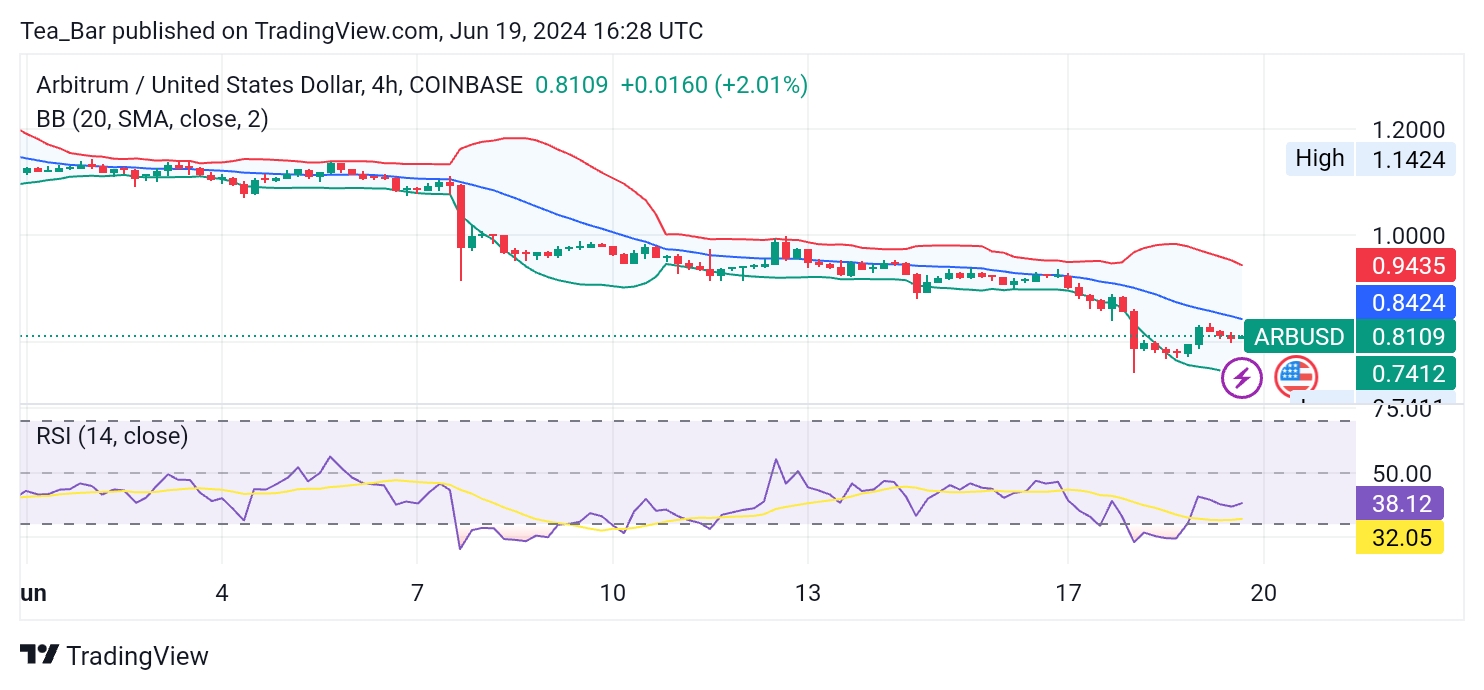
Conclusion: A Look Ahead
ARB’s current position suggests positive short-term momentum following its recent price increase. However, navigating this market effectively requires close attention to key support and resistance levels.
Immediate support rests around $0.7938, with additional support provided by the lower Bollinger Bands on both time frames. The initial hurdle lies near the current trading price of $0.8115, followed by the upper Bollinger Bands on both charts.
Overall, ARB presents a mixed technical outlook with hints of short-term bullish momentum amidst recent gains. Careful observation of price action around critical support and resistance levels is recommended, especially considering the oversold conditions highlighted by the RSI on both the daily and 4-hour charts.
Place winning Arbitrum trades with us. Get ARB here.