Arbitrum/ARB Technical Analysis: A Promising Outlook Despite Recent Dip
Estimated Reading Time: 3 minutes
Don’t invest unless you’re prepared to lose all the money you invest. This is a high-risk investment and you are unlikely to be protected if something goes wrong. Take 2 minutes to learn more

Arbitrum/ARB’s latest price at the time of writing is $0.6727, reflecting a modest dip of -0.39% in the past 24 hours. Despite this short-term decline, there’s a silver lining: Arbitrum (ARB) has closed above its opening price on 47.01% of days, indicating resilience and potential for upward movement.
Arbitrum (ARB) reached its all-time high of $2.27 five months ago. The current price marks a significant reduction of -70.33% from that peak. However, such retracements are not uncommon in the volatile world of cryptocurrencies and often precede substantial recoveries.
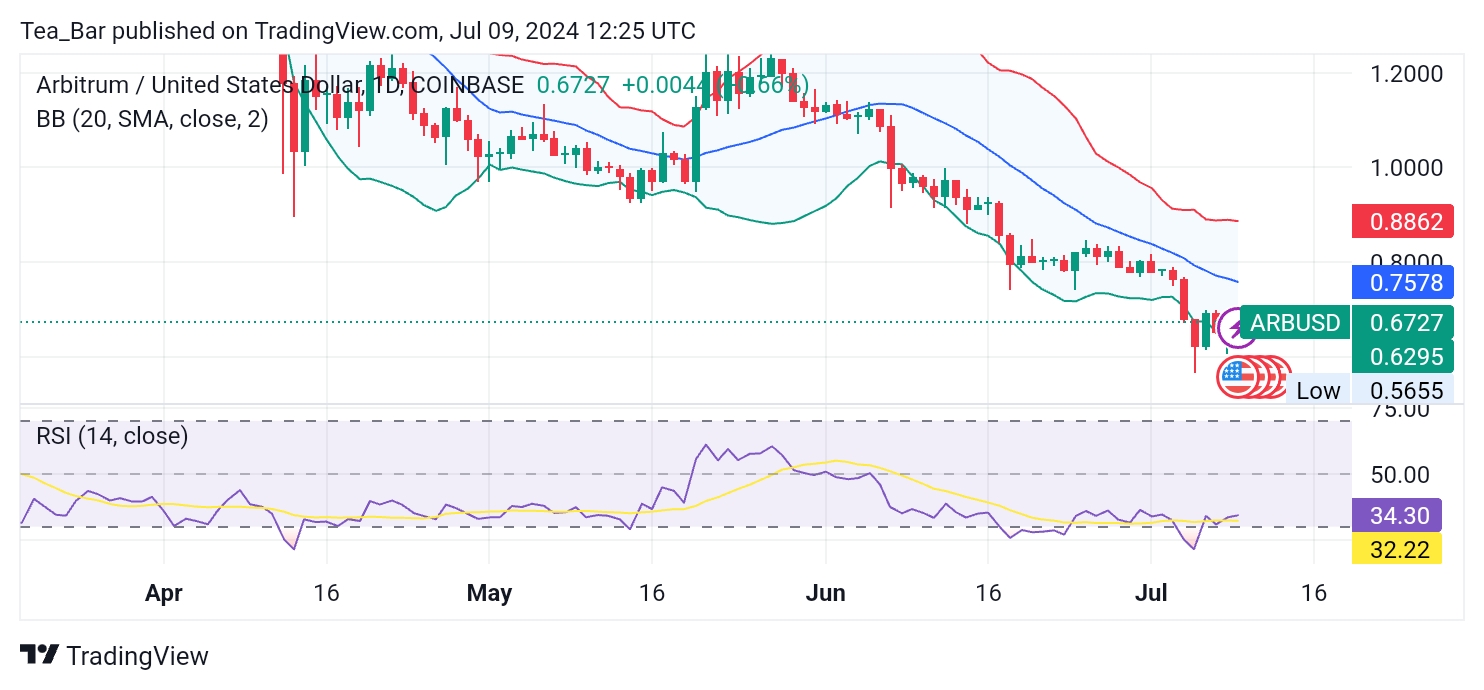
1-Day Chart Analysis
The upper band of the Bollinger Bands indicator is at $0.8862, the middle at $0.7578, and the lower at $0.6295. The current price sitting closer to the lower band suggests that ARB is potentially oversold, hinting at a buying opportunity.
At 32.22, the Relative Strength Index (RSI)is approaching the oversold threshold of 30. This further supports the notion that ARB may be undervalued at its current price, paving the way for a potential rebound.
4-Hour Chart Analysis
The upper band of the Bollinger Bands is at $0.7067, the middle at $0.6680, and the lower at $0.6293. Here, ARB is hovering near the middle band, indicating relative stability in the short term.
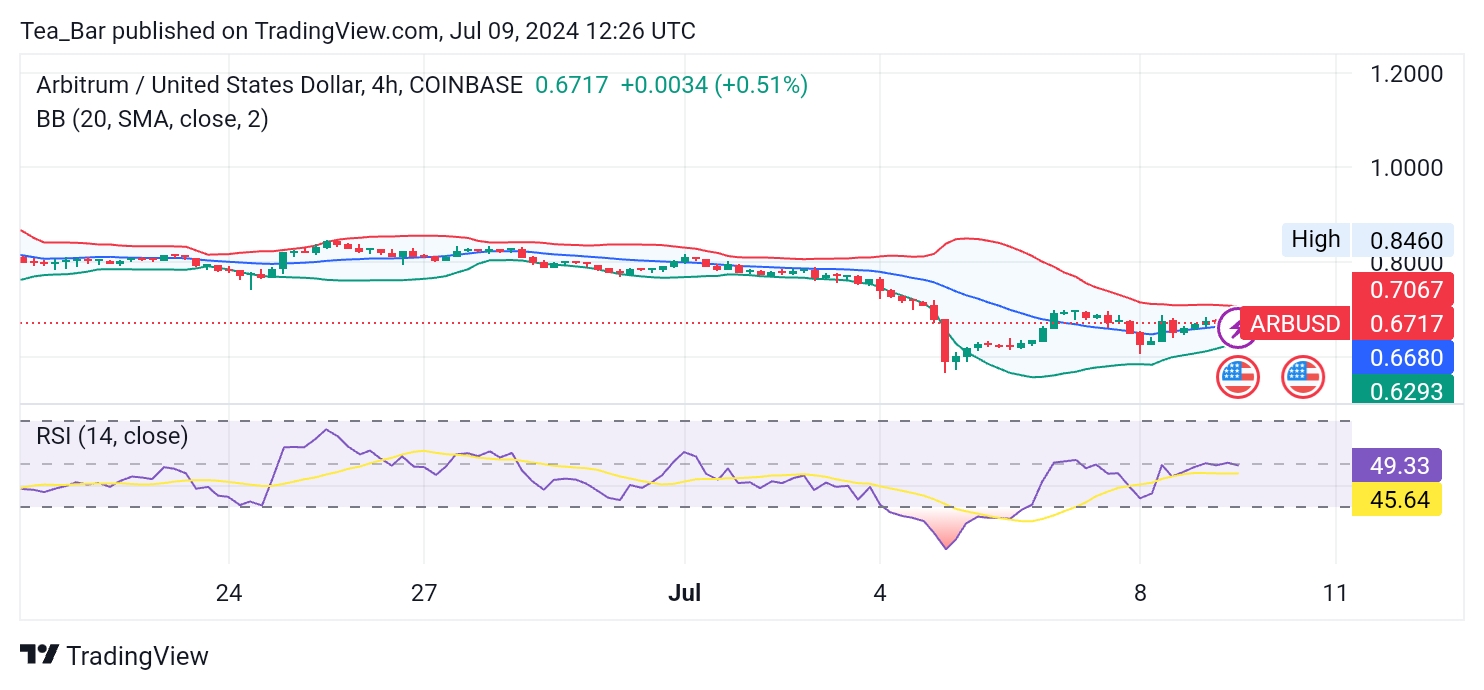
Source: TradingView
With a value of 45.64, the RSI suggests that ARB is neither overbought nor oversold, maintaining a neutral stance which can swiftly change given market dynamics.
Conclusion
Despite a noticeable drop from its all-time high, ARB shows signs of potential recovery. The 1-day chart suggests a possible undervaluation with the price near the lower Bollinger Band and an RSI approaching oversold levels, which could indicate a buying opportunity for long-term investors.
The 4-hour chart, with its middle Bollinger Band position and neutral RSI, indicates short-term stability without significant overbought or oversold conditions.
In order to place winning trades with us via Bybit, You can open an account here.