Crypto Divergence Trading: How to Spot Hidden Reversals with RSI and MACD
Estimated Reading Time: 8 minutes
Don’t invest unless you’re prepared to lose all the money you invest. This is a high-risk investment and you are unlikely to be protected if something goes wrong. Take 2 minutes to learn more
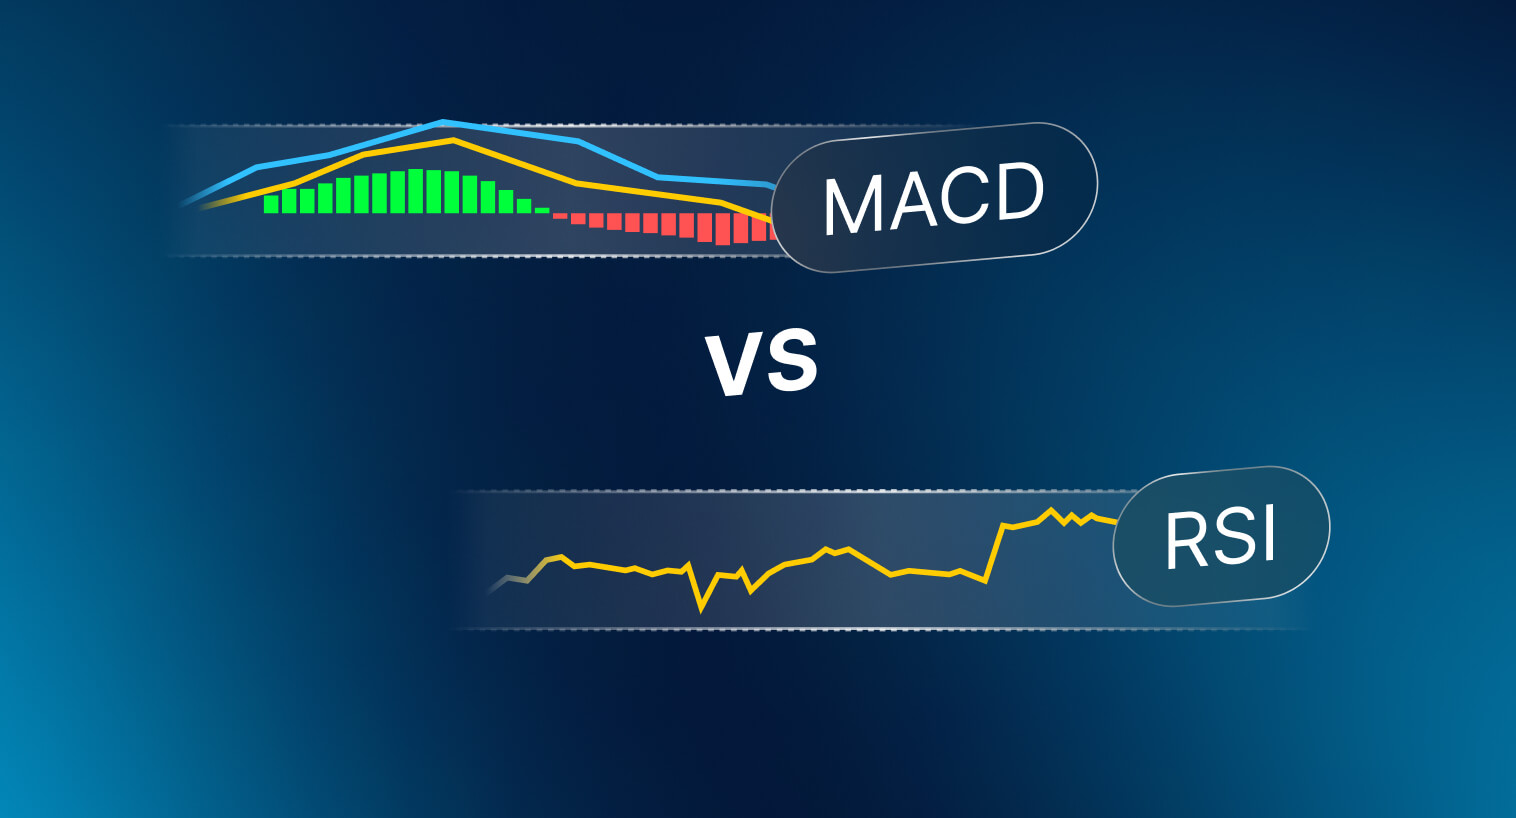
Most traders get into crypto chasing 10x moves, but they miss the subtle signals that appear right before those moves — the moment when momentum shifts under the surface while price still looks fine. Divergence is that signal. When Bitcoin prints a higher high but the RSI prints a lower high, the crowd stays long while smart money starts flipping short. This guide breaks down how to read divergence with RSI and MACD, how to filter out failing signals, and how to build a trading plan around it.
Key Takeaways
- Divergence occurs when price makes a higher high (or lower low) but the oscillator doesn’t confirm — signaling weakening momentum.
- Regular divergence warns of reversals; hidden divergence signals trend continuation.
- RSI divergence works best on the 4-hour and daily charts for BTC/USDT and ETH/USDT.
- MACD histogram divergence catches momentum shifts one to three candles earlier than RSI.
- Always confirm with volume or a second indicator — standalone signals fail too often.

Free Crypto Signals Channel
 Free Telegram Channel
What Divergence Actually Is — and Why It Works
Divergence is the disagreement between price action and an oscillator. Price makes a higher high, but RSI makes a lower high — that’s bearish divergence. The engine behind the rally is losing power. In reverse: a lower low in price with a higher low on RSI is bullish divergence — sellers are exhausting themselves.
This works especially well in crypto because these markets are sentiment-driven to an extreme. Retail chases green candles and panic-sells red ones. Divergence catches the point where that sentiment is about to flip.
Regular Divergence signals reversal. In an uptrend, price makes a higher high but the oscillator makes a lower high — bearish. In a downtrend, price makes a lower low but the oscillator makes a higher low — bullish.
Hidden Divergence signals continuation. In an uptrend, price makes a higher low but the oscillator makes a lower low — the trend stays intact. In a downtrend, price makes a lower high but the oscillator makes a higher high — the trend continues down.
The key: regular divergence fights the trend (reversal), hidden divergence joins it (continuation). If you’re seeing “failed” divergence, check whether you were reading regular divergence in a strong trend when the market was giving you hidden divergence instead.
RSI Divergence: The Workhorse
Use the standard 14-period RSI on the 4-hour or daily chart. Lower timeframes produce too many false signals.
Draw trendlines on both price and RSI. A bearish setup: two swing highs on price where the second is higher, paired with two swing highs on RSI where the second is lower. Don’t eyeball it — draw the lines. If price slopes up and RSI slopes down, you have divergence.
Wait for confirmation. RSI needs to break below 50 or its own trendline before you enter. Entering on the first hint of divergence without confirmation gets you run over — price can stay divergent for days.
Real example: March 2024, Bitcoin printed a daily high near $73,000, then a marginal new high around $73,800. The daily RSI made a lower high, dropping from 78 to 72. That bearish divergence preceded a 15% correction over three weeks. Traders who waited for RSI to break below 50 caught most of that move.
Bullish example: Solana in late 2023 made a low near $18, then a lower low near $17, but RSI made a higher low. When RSI broke above 40 then 50, SOL ripped to over $120 in three months.
Pitfall: in strong trends, RSI can stay overbought for weeks. Shorting the first bearish divergence in a bull market often produces only a shallow pullback. Context matters more than the signal itself.
MACD Divergence: Earlier Warnings
While RSI measures price speed, MACD measures the relationship between two EMAs. The histogram — showing the distance between the MACD line and signal line — gives earlier warnings than crossovers.
When histogram bars shrink while price makes new highs, momentum is decelerating. This often appears one to three candles before RSI divergence.
For bearish MACD divergence on BTC 4-hour: price makes a higher high, but the MACD histogram prints a lower peak. Enter when the MACD line crosses below the signal line. For bullish: price makes a lower low, histogram prints a shallower trough. Enter when MACD crosses above signal.
The strongest setups occur when RSI and MACD agree. In June 2024, Ethereum showed bearish divergence on both indicators — price made a marginal higher high near $3,970 while both RSI and MACD made lower highs. Volume on the second rally was 30% lower. ETH dropped to $2,800 within three weeks. Convergence of both indicators plus volume decline was the tell.
Don’t trade MACD divergence below the 4-hour chart — by the time it confirms on lower timeframes, the move is half over.
Avoiding Failed Signals
Strong trend divergence often fails. If Bitcoin is in a parabolic rally, daily RSI will show bearish divergence repeatedly while price keeps climbing. If the weekly chart is bullish, be skeptical of daily bearish divergence.
Bad swing identification. Divergence requires clear swing highs and lows surrounded by lower candles on both sides. Connecting random RSI wiggles is noise, not divergence.
No confirmation before entry. Price can stay divergent for days. Wait for a bearish engulfing candle, a break below a key EMA, or RSI crossing below 50 for shorts. For longs, wait for a bullish engulfing or RSI crossing above 40-50.
RSI range matters. Bearish divergence with RSI above 70 is much more significant than at 55. Bullish divergence below 30 is more reliable than at 45.
 Most Popular
- 2-5 Signals Daily
- 82% Success Rate
- Entry, Take Profit & Stop Loss
- Amount To Risk Per Trade
- Risk Reward Ratio


Building a Divergence Trading Plan
Timeframes. Use 4-hour for entries, daily for context. Both agree? Size up. They disagree? Size down or skip.
Pair selection. Stick to BTC/USDT, ETH/USDT, SOL/USDT. Lower-cap alts produce more signals but also more false ones.
Entry rules. Bearish: wait for RSI to break below its swing low or 50. Enter short on the confirmation candle close. Stop above the recent swing high. Bullish: wait for RSI to break above its swing high or 50. Enter long. Stop below the recent swing low.
Position sizing. A BTC 4-hour swing might require a 3-5% stop. Size so a stop-out costs 1-2% of your account.
Take profits. Target the next significant support or resistance. Scale out: 50% at first target, stop to breakeven, let the rest run with a trailing stop.
Journal everything. Screenshot setups, annotate, and review after the trade closes. A journal turns 100 trades into a data set you can improve from.
Advanced Setups
Triple divergence. Three consecutive lower highs on RSI against three higher highs on price. Rarer than double divergence but produces stronger reversals.
Divergence at key levels. Bearish divergence at a major resistance like Bitcoin’s previous all-time high is far more significant than in the middle of nowhere. Confluence turns a decent setup into a high-probability one.
RSI failure swings. For bearish: RSI enters overbought above 70, pulls back, rallies but fails to reach 70, then drops below its previous pullback low. Stronger than basic divergence because it shows an actual failure to reclaim overbought territory.
Conclusion
Divergence trading gives you what most retail traders lack: the ability to see momentum shifting before price confirms it. When you combine RSI and MACD divergence with multi-timeframe context, you’re reading the footprints of positioning before the crowd catches on.
Start with BTC and ETH on the daily chart using RSI alone. Paper trade until you can spot setups without hesitation. Then layer in MACD and confirmation rules. The goal isn’t to catch every reversal — it’s to catch the ones with enough confluence that the odds are stacked in your favor.
Educational content only. Not financial advice. Always do your own research.