UNUS SED LEO Price Prediction: LEO/USD Trades Near $4.00 Resistance
Estimated Reading Time: 3 minutes
Don’t invest unless you’re prepared to lose all the money you invest. This is a high-risk investment and you are unlikely to be protected if something goes wrong. Take 2 minutes to learn more
UNUS SED LEO Price Prediction – June 28
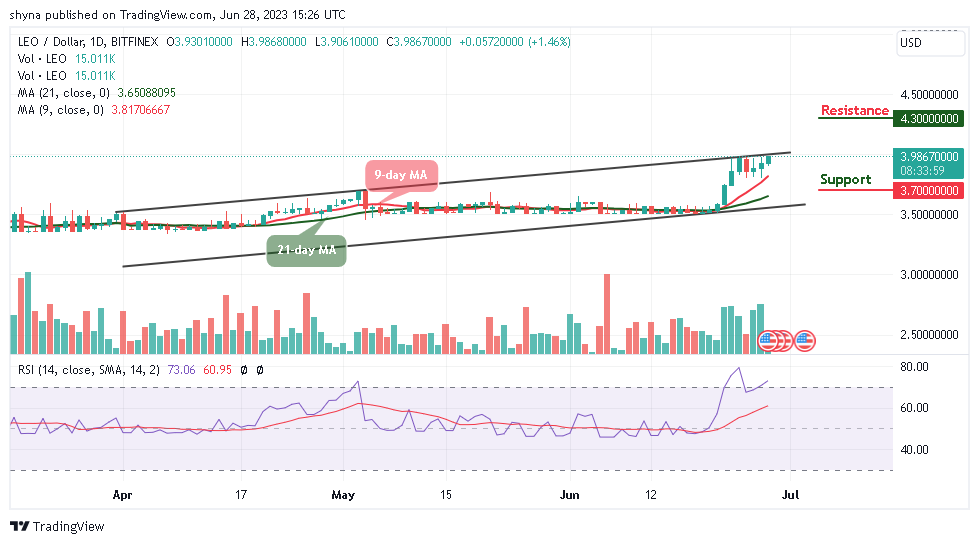
As the daily chart reveals, the UNUS SED LEO price is trading near the resistance level of $4.00 as the recovery comes slowly.
LEO/USD Long-term Trend: Ranging (Daily Chart)
Key levels:
Resistance Levels: $4.30, $4.32, $4.34
Support Levels: $3.70, $3.68, $3.66
At the time of writing, LEO/USD is seen trading at $3.98 after soaring toward the upper boundary of the channel. The UNUS SED LEO price is also seen pulling back to where it is currently trading and may likely head downwards if the bears step back into the market.
UNUS SED LEO Price Prediction: LEO/USD May Break Above the Channel
On the bullish side, the UNUS SED LEO price needs to remain above the 9-day and 21-day moving averages, otherwise, there may come a bearish breakdown when LEOUSD falls below that barrier. The 9-day MA is above the 21-day MA as the technical indicator Relative Strength Index (14) is sending moderate signs above the overbought region where an oscillation to the higher boundary may confirm the proper trend which is more likely a bullish trend at the time of the outcome.
However, LEO/USD will confirm the bullish trend if the market price moves above $4.00. Meanwhile, the UNUS SED LEO price may follow the bearish trend if the price moves toward the moving averages and face the lower boundary of the channel. Should this happen, the coin may drop to the supports of $3.70, $3.68, and $3.66. Otherwise, a strong bullish spike may push the price toward the resistance levels of $4.30, $4.32, and $4.34.
LEO/USD Medium-Term Trend: Bullish (4H Chart)
Looking at the 4-hour chart, the UNUS SED LEO price is currently crossing above the 9-day and 21-day moving averages. If the price continues to rise further and move above the upper boundary of the channel, it could reach the nearest resistance levels at $4.20 and above.

Moreover, if the bears push the coin below the 21-day moving average, the price of UNUS SED LEO may likely reach the closest supports at $3.80 and below. Now, the technical indicator Relative Strength Index (14) is seen moving toward the overbought region, crossing above it may confirm the bullish trend for the market.
Place winning LEO trades with us. Get LEO here