Crypto Trading Fees Explained: How Hidden Costs Steal Your Profits
Estimated Reading Time: 13 minutes
Don’t invest unless you’re prepared to lose all the money you invest. This is a high-risk investment and you are unlikely to be protected if something goes wrong. Take 2 minutes to learn more
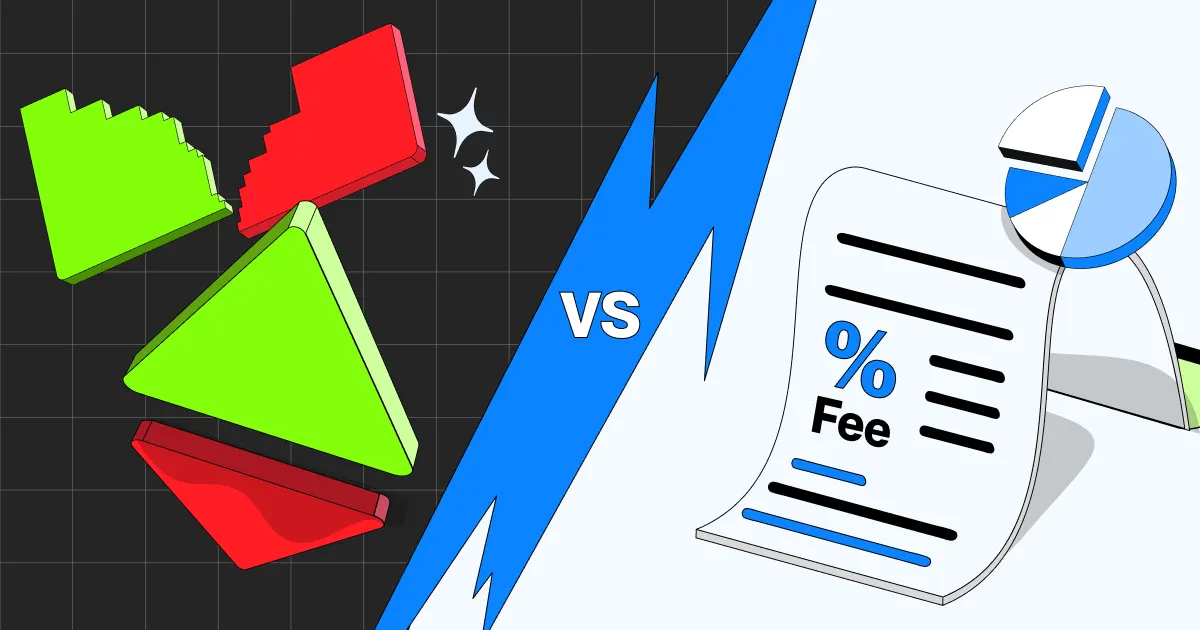
If you’ve ever wondered why your P&L doesn’t quite match what the chart says it should be, the answer is almost always fees. Most traders fixate on entry and exit prices — did I buy SOL at $140 or $142? — but ignore the 0.1% here and 0.05% there that gets skimmed off every trade. Over a month of active trading, those fractions add up. Over a year, they can be the difference between a profitable strategy and one that’s bleeding money while you convince yourself you just need to “refine the edge.”
A trader making 10 round-trip trades per day on a $5,000 account with 0.1% fees is paying roughly $10/day in fees. That’s $3,650 a year — 73% of their starting capital, before any market P&L. If their strategy averages 2% per month in gross returns, fees alone wipe out nearly a third of that. If the strategy is only marginally profitable, fees turn it negative.
This article walks through every type of fee you’ll encounter on crypto exchanges — the obvious ones, the hidden ones, and the ones the marketing pages don’t mention until you read the fine print.
Key Takeaways
- Maker and taker fees are the visible costs, but spreads, funding rates, and withdrawal fees can quietly drain 2-5x more than the headline trading fee suggests.
- Using limit orders (maker) instead of market orders (taker) can cut your per-trade fee by 50-80% on most exchanges.
- On-chain transaction fees for DEX trading can range from pennies on Solana to $50+ on Ethereum during congestion — pick your chain accordingly.
- Holding exchange tokens (BNB, CRO, etc.) almost always unlocks a fee discount tier, and the savings from even basic-tier holding can cover the cost of the tokens themselves within months of active trading.
- Fee structures are not static. Exchanges change them. What was competitive six months ago might be expensive today. Check quarterly.

Free Crypto Signals Channel
 Free Telegram Channel
The Visible Costs: Maker and Taker Fees
Every centralized exchange (CEX) uses a maker-taker fee model. The logic is simple, but the implications for how you trade aren’t always obvious.
Maker Fees
A maker order “makes” liquidity. It sits on the order book waiting to be filled. When you place a limit order to buy BTC at $64,500 while the market is at $65,000, you’re a maker. Your order adds depth to the book, and the exchange rewards you with a lower fee — typically 0.02% to 0.10% depending on your volume tier.
Taker Fees
A taker order “takes” liquidity off the book. When you hit the market buy button and get filled at the best available ask, you’re a taker. You’re removing liquidity, which costs the exchange slightly more to process (and they pass that cost to you). Taker fees typically run 0.04% to 0.15%.
The spread between maker and taker fees isn’t trivial. On Binance, the base tier is 0.10% for both maker and taker. On Bybit, it’s 0.10% maker and 0.10% taker at base. On Coinbase Advanced, it’s 0.40% maker and 0.60% taker at the lowest volume tier — significantly more expensive.
The Real-World Impact
Let’s put this in dollar terms for a trader with a $10,000 account who trades actively.
Say you average 5 round-trip trades per day — one open, one close. That’s 10 individual trades per day, 300 per month. With a $1,000 position size per trade:
- At 0.10% taker fee: $1 per trade × 300 trades = $300/month in fees. That’s 3% of the account per month, 36% annualized, just on fees.
- At 0.02% maker fee: $0.20 per trade × 300 = $60/month. That’s 0.6% per month — still significant, but 5x less than the taker route.
The difference between using limit orders and market orders is $240/month on this hypothetical account. Over a year, that’s $2,880 — nearly 29% of the starting capital, lost to impatience.
Takeaway: if you’re paying taker fees on every trade, you’d better have a strategy that consistently beats the market by enough to cover them. Most don’t. Switching to limit orders — even if it means occasionally missing a fill — usually saves more than it costs.
The Hidden Costs: Spread and Slippage
Maker and taker fees are the cost you see on your trade confirmation. Spread and slippage are the costs you don’t see.
The Bid-Ask Spread
The spread is the gap between the highest bid (what someone is willing to pay) and the lowest ask (what someone is willing to sell for). If BTC’s bid is $64,990 and ask is $65,010, the spread is $20, or about 0.03%.
When you market-buy BTC, you pay the ask ($65,010). If you immediately market-sell it, you get the bid ($64,990). You’ve lost $20, or 0.03%, without the price moving at all. That’s the spread cost.
For liquid pairs like BTC/USDT, the spread is usually tight — 0.01-0.03%. For altcoins on DEXs or less liquid CEX pairs, spreads can be 0.5% to 5% or worse. A 2% spread on a $1,000 trade is $20 — equivalent to a 2% taker fee, just invisible because it’s baked into the execution price rather than listed as a line item.
Slippage
Slippage happens when your order is large enough to eat through multiple levels of the order book. You market-buy 10 ETH at $3,200, but the order book only has 3 ETH available at $3,200. The next 4 ETH are at $3,205, and the last 3 are at $3,212. Your average fill price is around $3,205 — $5 per ETH worse than the displayed price. On a $32,000 order, that’s a hidden $50 cost.
Slippage is worse on DEXs because on-chain liquidity is thinner. An AMM (automated market maker) like Uniswap prices based on a formula — the more you buy relative to the pool size, the worse your price. A $50,000 buy on a low-liquidity Uniswap pool can have 5-10% slippage. That’s $2,500-$5,000 in hidden cost on a single trade.
The fix for slippage isn’t complicated:
- On CEXs, use limit orders or break large market orders into smaller chunks.
- On DEXs, set a slippage tolerance (usually 0.5-1% for major pairs, 2-3% for alts) and understand that anything above that means your trade is too large for the available liquidity.
- For large DEX trades, use an aggregator like 1inch or Jupiter that splits the order across multiple pools to minimize price impact.
 Most Popular
- 2-5 Signals Daily
- 82% Success Rate
- Entry, Take Profit & Stop Loss
- Amount To Risk Per Trade
- Risk Reward Ratio


The Ongoing Drain: Funding Rates on Perpetual Futures
If you trade perpetual futures (perps), there’s a cost that doesn’t exist in spot trading: funding rates.
Funding rates are periodic payments between longs and shorts designed to keep the perpetual futures price anchored to the spot price. Every 8 hours (on most exchanges), one side pays the other. If the perpetual price is above spot — which usually means more people are long than short — longs pay shorts. If perps are below spot, shorts pay longs.
During bull markets, funding rates trend positive because everyone is long. During the 2024-2025 bull run, BTC funding rates on Binance routinely hit 0.05% per 8-hour period during rallies. That’s 0.15% per day, or about 55% annualized.
For a spot holder, this doesn’t matter — you own the asset. For a leveraged perp trader, it’s a direct cost. If you’re 10x long on BTC with $1,000 margin ($10,000 position), a 0.05% funding rate means you’re paying $5 every 8 hours — $15/day, $450/month. On a $1,000 account, that’s a 45% monthly drain from funding alone.
When funding rates are high, the rational move is to either:
- Close the leveraged long and switch to spot (you keep exposure without the funding drain).
- Short the asset and collect the funding payments (but you’re betting against the trend — dangerous without a clear reversal signal).
- Reduce leverage so the funding cost as a percentage of your account is manageable.
A simple rule: if the funding rate exceeds 0.03% per 8-hour period on your chosen pair, check whether your trade thesis justifies paying it. If you’re holding for a swing trade over 2-3 days and funding is 0.05%, you’re paying 0.45% in funding costs over three days. If your expected profit is 3%, funding alone eats 15% of your edge.
Exchange Fee Comparison: What You’re Actually Paying
Fee structures change, but here’s a snapshot of base-tier fees at major exchanges as of mid-2026:
| Exchange | Maker Fee | Taker Fee | Spot/Futures |
|---|---|---|---|
| Binance | 0.10% | 0.10% | Both |
| Bybit | 0.10% | 0.10% | Both |
| OKX | 0.08% | 0.10% | Spot |
| OKX | 0.02% | 0.05% | Futures |
| Coinbase Advanced | 0.40% | 0.60% | Spot |
| Kraken Pro | 0.16% | 0.26% | Spot |
| KuCoin | 0.10% | 0.10% | Both |
| Hyperliquid | 0.02% | 0.05% | Perps only |
At first glance, OKX’s 0.02% maker fee on futures is the standout. But fees aren’t the whole picture. An exchange with 0.02% maker fees but terrible liquidity could cost you more in slippage than you save in fees. Always test an exchange with small trades before migrating significant volume.
Fee Discounts You Should Be Using
Almost every exchange offers a discount if you hold and use their native token:
- Binance: Pay fees in BNB for a 25% discount on spot and futures. Plus tier-based discounts for higher BNB balances and 30-day volume.
- Bybit: No direct token discount on trading fees, but VIP tiers (based on asset balance or 30-day volume) reduce fees significantly. The lowest VIP tier drops taker fees to 0.08%.
- OKX: Hold OKB for tier upgrades that reduce fees.
- KuCoin: Pay fees with KCS for a 20% discount.
- Crypto.com Exchange: Stake CRO for fee reductions, with higher tiers unlocking maker rebates (yes, they pay you to trade).
If you’re trading actively enough that fees matter, holding a small amount of the exchange’s token almost always pays for itself. A $500 BNB position unlocks the 25% fee discount on Binance. If you pay $200/month in fees without the discount, that’s $600/year — the $500 BNB position pays for itself in 10 months, and you still own the BNB.
DEX Fees: Gas Costs and Pool Fees
Trading on decentralized exchanges adds another layer of costs that CEX traders don’t face.
Gas Fees
Every DEX trade is an on-chain transaction, and every on-chain transaction costs gas. The cost varies wildly by chain:
- Ethereum: $5-$50 for a simple swap during normal conditions. During NFT mints or airdrop claims, gas can spike to $100+. A $500 trade with a $30 gas fee is paying 6% in transaction costs — worse than any CEX.
- Solana: $0.0002-$0.002 per transaction. Effectively free for any trade above a few dollars.
- Arbitrum / Optimism / Base (L2s): $0.01-$0.50 typically. Cheap enough that gas isn’t the deciding factor for most traders.
- BNB Chain: $0.03-$0.30. Consistently cheap.
- Avalanche: $0.02-$0.10. Also cheap.
If you’re trading small sizes — under $500 per trade — Ethereum mainnet DEX trading makes no economic sense unless you’re interacting with a specific protocol that only exists there. The gas cost alone is a larger percentage drag than any edge your strategy might have. For small-size DEX trading, Solana, Arbitrum, Base, or BNB Chain are the practical choices.
Pool Fees (AMM)
Every AMM pool charges a fee, typically 0.05% to 1% per swap, paid to liquidity providers. Uniswap V3 pools range from 0.01% (stablecoin pairs) to 1% (volatile/exotic pairs). The fee is baked into the swap — you don’t see it as a line item, but it’s in the price you get.
A DEX aggregator like 1inch or Jupiter routes your trade through multiple pools and chains to minimize the combined cost — finding the path with the lowest total cost (pool fee + gas + price impact). For any DEX trade over a few hundred dollars, using an aggregator almost always gets you a better price than swapping directly on a single pool.
How to Audit Your Own Fee Spend
Most traders have no idea what they spend on fees. Here’s how to find out:
1. Export your trade history from your exchange (every major exchange supports CSV export).
2. Add a “fee” column total. If your exchange doesn’t include a fee column, calculate it: for taker trades, it’s position size × taker fee rate. For maker, position size × maker fee rate.
3. Sum it by month. Compare it to your monthly P&L. If fees are consuming more than 20-30% of your gross profits, you have a fee problem — not a strategy problem.
4. Check your maker/taker ratio. If less than 50% of your trades are maker orders, you’re probably overpaying. Target 70%+ maker orders unless you have a specific reason to be a taker (e.g., breakout strategies where speed matters more than cost).
You’ll likely be surprised by the number. Almost every trader underestimates their fee spend until they actually calculate it.
Conclusion
Crypto trading fees are the silent compounding cost that separates profitable traders from break-even ones. The headline rate — 0.1% here, 0.06% there — looks small on a single trade. But a trader making 300+ trades per month is paying a fee on every open and every close, creating a cost structure that can easily exceed their edge.
The fixes aren’t complicated: use limit orders instead of market orders, hold exchange tokens for discounts, trade on exchanges and chains with competitive fee structures, and check your funding rates before opening leveraged positions. None of these steps require more skill or better market reads — they’re purely operational improvements that anyone can implement.
Spend 30 minutes doing a fee audit on your last three months of trading. If the number is higher than you expected, congratulations — you just found your easiest edge. Cutting fees doesn’t require better entries, better exits, or a better strategy. It just requires paying attention.
Educational content only. Not financial advice. Always do your own research.