Bitcoin (BTC) Price Prediction: BTC/USDT Pulls the Brakes Above the $66,000 Mark
Estimated Reading Time: 3 minutes
Don’t invest unless you’re prepared to lose all the money you invest. This is a high-risk investment and you are unlikely to be protected if something goes wrong. Take 2 minutes to learn more

Bitcoin (BTC) Price Prediction: July 31
The BTC/USDT market had touched the resistance at $70,000 but quickly reversed afterward. This occurred as price action failed to secure a support level above the $70,000 price level. Some indications suggest the market isn’t ready to lose support at the $66,000 mark.
BTC/USDT Long-term Trend: Bearish (Daily Chart)
Key Price Levels:
Resistance Levels: $68,000, $70,000, and $72,000
Support Levels: $66,000, $64,000, and $62,000
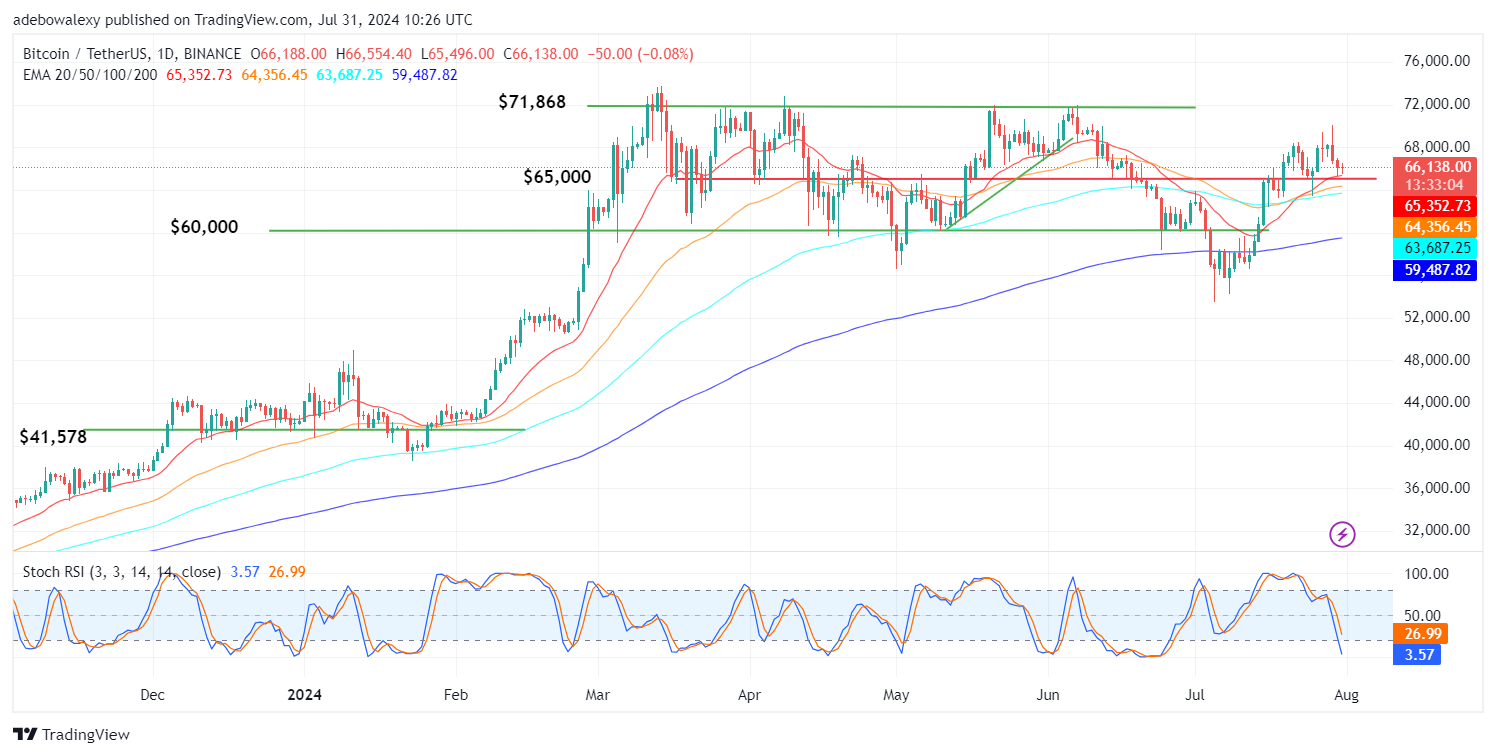
Today’s trading session appears as a red doji price candle, standing just above the 20-day Exponential Moving Average (EMA) lines. Meanwhile, the Stochastic Relative Strength Index (SRSI) lines are falling steeply into the oversold region. This is interesting given the magnitude of the price decline that caused such a significant movement in the SRSI indicator lines.
Bitcoin Price Prediction: Bulls Seem Solidly Behind the $66,000 Mark in the BTC/USDT Market
Activities seen in the Bitcoin daily market support the opinion that prices may not be able to fall below the $66,000 mark. This is suggested by the appearance of the last price candle on this chart. Its appearance suggests that upside and downward forces are engaged.
This stance can be seen above all the EMA curves. Likewise, the SRSI indicator lines have fallen too far into the oversold region, while price action hasn’t seen much downward movement. This gives the impression that downward forces may be weak at this point.
BTC/USDT Medium-term Trend: Bitcoin Market Consolidates Between EMA Curves (4H Chart)
Price action in the BTC market can be seen as consolidating as it now lies between the 20-, 50-, 100-, and 200-day EMA lines. The 20- and 50-day EMA lines can be seen converging steadily above price movement. Meanwhile, the market is moving sideways above the 100-day line. The SRSI indicator lines are still in the oversold region, with a slight upward trajectory.
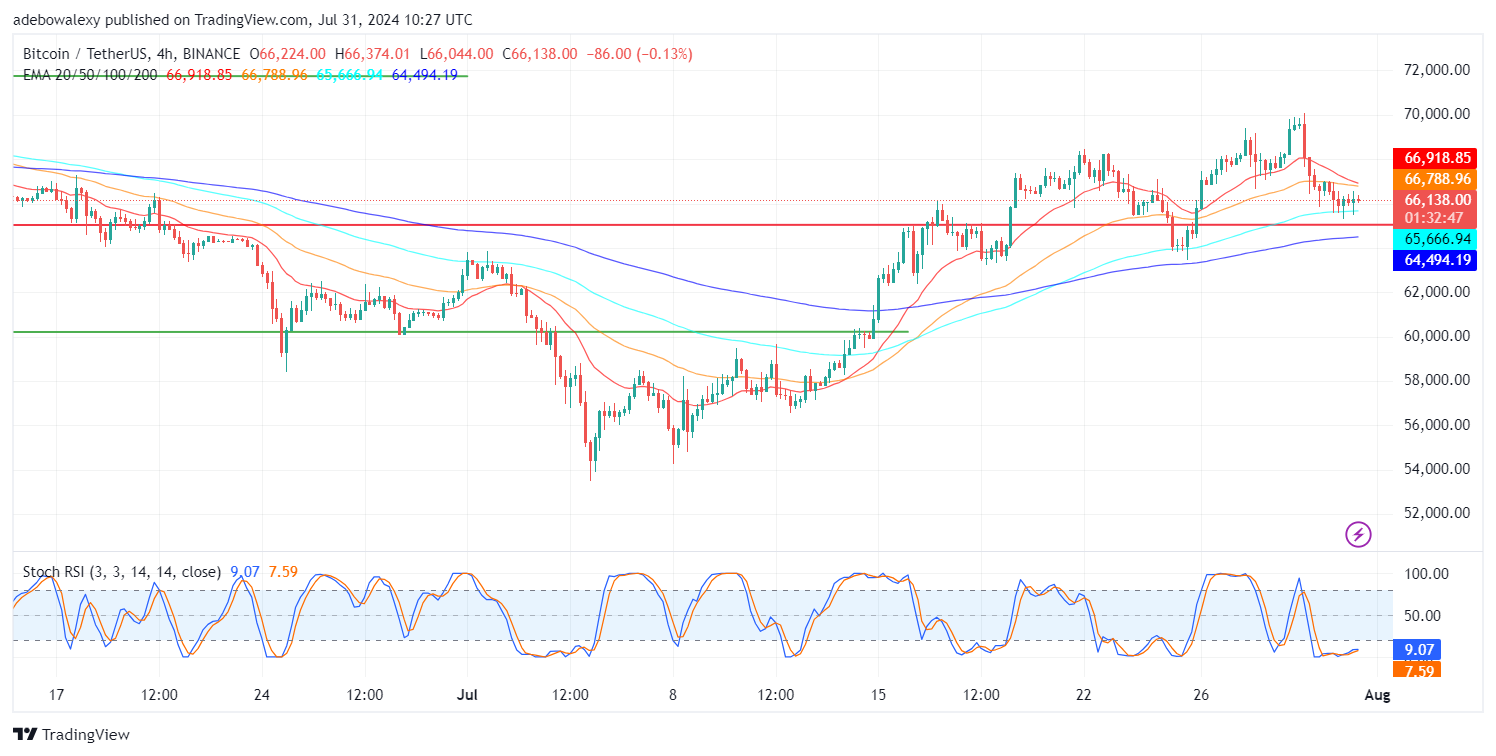
The used technical indicators in this market seem divergent on a fundamental basis. The convergence of the EMA lines suggests that downward forces may gain momentum. Meanwhile, the slight upward trajectory seen on the SRSI indicator hints that upside forces are gaining momentum. Nevertheless, it will be safe to wait and see if the market will rise above the $66,918 mark before targeting higher price levels. Otherwise, price action may hit the $66,000 price level in an attempt to fall below it.