Tamadoge (TAMA/USD): Gearing Up for a Potential Bullish Surge
Estimated Reading Time: 3 minutes
Don’t invest unless you’re prepared to lose all the money you invest. This is a high-risk investment and you are unlikely to be protected if something goes wrong. Take 2 minutes to learn more
In the previous analysis of TAMA/USD, it was highlighted that a potential rally from the $0.00065 support level toward $0.0008 was likely. This expectation materialized as the price gained momentum and surged toward $0.0008. The bullish momentum briefly extended to $0.0009, where the market encountered strong resistance. However, buyers failed to sustain the price above $0.0008, leading to a bearish reversal from the $0.0009 level.
The initial bearish pullback was gradual, with a slowdown around $0.0008, as bullish sentiment attempted to regain control near $0.0007. However, once sellers established dominance at $0.0007, the decline accelerated, driving the price back down to the critical $0.00065 support level.
Key Levels
- Resistance: $0.0009, $0.0010, and $0.0011
- Support: $0.00065, $0.00060 and $0.00055
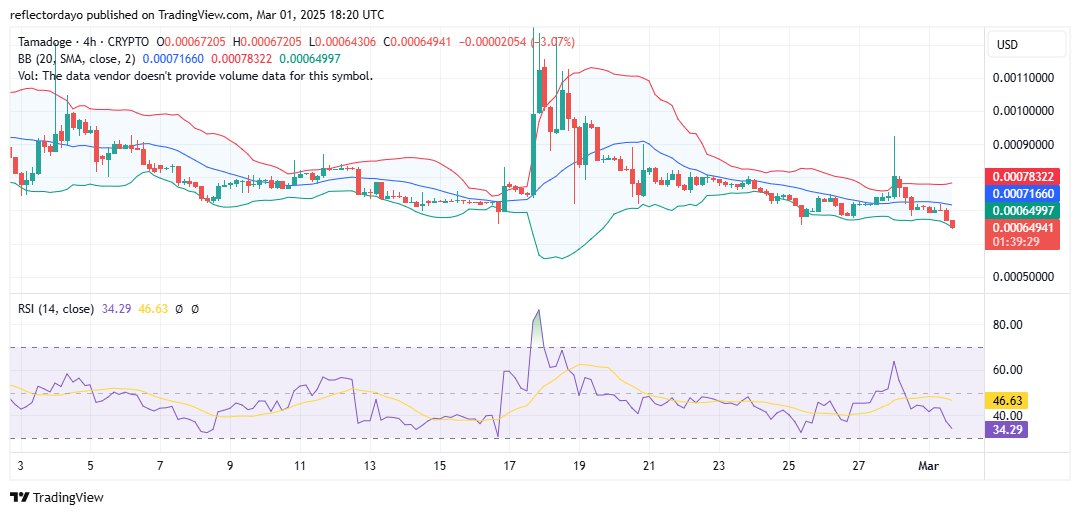
TAMA/USD Price Analysis: The Indicators’ Point of View
Currently in the TAMA/USD market, as the price reaches the key support level at $0.00065, bullish pressure has emerged, preventing further downside movement. The bearish breakout from the $0.0007 level was particularly strong, driven by significant selling momentum, which increased market volatility. However, despite this surge in bearish activity, buyers have managed to hold their ground around $0.00065.
Given this resilience, a potential rally toward $0.0008 is likely. If the crypto signal faces resistance and pulls back from $0.0008, the $0.0007 level is expected to act as a key support, potentially stabilizing the market and keeping it within a sideways range between these price zones.
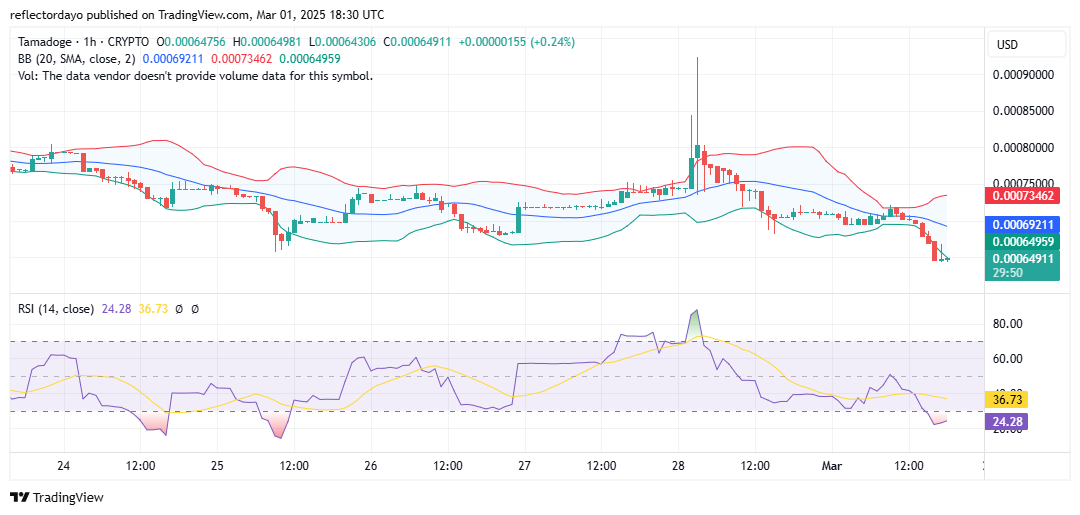
Tamadoge Short-Term Outlook: 1-Hour Chart
The market structure becomes clearer when viewed from the 1-hour chart. As the bearish momentum tested this key level, it appeared to hit a strong support zone, resembling a “brick wall.” This formation suggests that the market is preparing for a potential bounce.
Notably, a gravestone doji has formed on the chart, signaling that buyers attempted to push the price higher but were ultimately overpowered by sellers before the close. However, the presence of strong buying pressure within the session indicates that bearish momentum may be weakening.
Additionally, the Relative Strength Index (RSI) is currently below the 30 level, placing it in the oversold region. This could encourage traders to adopt a more bullish bias and take long positions, anticipating a reversal.
Buy Tamadoge!
Fill your weekend by playing five exhilarating play-to-earn arcade games! 🕹️💰
Battle your way to the top of the weekly leaderboards and load up on $TAMA rewards!
Download on mobile now 👇
📱 Android: https://t.co/D4TjX7gTFl
📱 iOS: https://t.co/0fjJapf5oA pic.twitter.com/6MCruiKcet— TAMADOGE (@Tamadogecoin) September 13, 2024