Lucky Block (LBLOCK) Price Analysis: SAR & MACD Align for Major Breakout – Retesting ATH in Sight
Estimated Reading Time: 3 minutes
Don’t invest unless you’re prepared to lose all the money you invest. This is a high-risk investment and you are unlikely to be protected if something goes wrong. Take 2 minutes to learn more

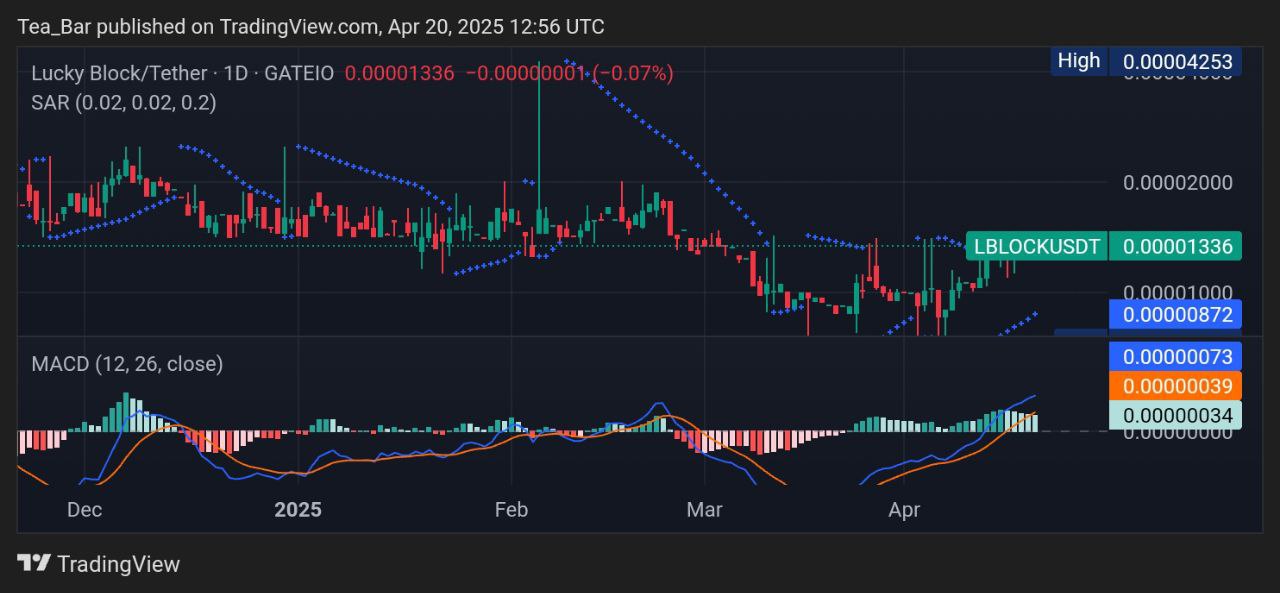
Lucky Block (LBLOCK) is emerging as a standout candidate for bullish momentum, with technical indicators hinting at a potential surge. Trading at 0.00001336 USDT as of April 20, 2025, Lucky Block has stabilized above critical support levels despite minor price fluctuations. The convergence of the Parabolic SAR (0.02, 0.02, 0.2) and MACD (12, 26, close) across daily and 4-hour charts underscores weakening bearish pressure. With its all-time high (ATH) of 0.00004253 USDT still in play as a long-term target, Lucky Block’s current consolidation phase presents a strategic opportunity for traders anticipating a breakout.
Lucky Block Daily Chart: Bullish Reversal Takes Shape
The daily chart reveals a compelling setup for Lucky Block. The Parabolic SAR dots rest firmly below the price, signaling bullish control, while the MACD line inches closer to a bullish crossover. Notably, Lucky Block has defended the 0.00000872 support level multiple times, showcasing resilience against downward pressure. This stability mirrors patterns seen ahead of its historic rally to 0.00004253 USDT in early 2025. Current price action near 0.00001336 suggests accumulation, a common precursor to explosive moves in volatile assets like Lucky Block. A breakout above 0.00001402 could reignite bullish momentum, targeting the 0.00002000 resistance zone.
4-Hour Chart: Short-Term Momentum Builds
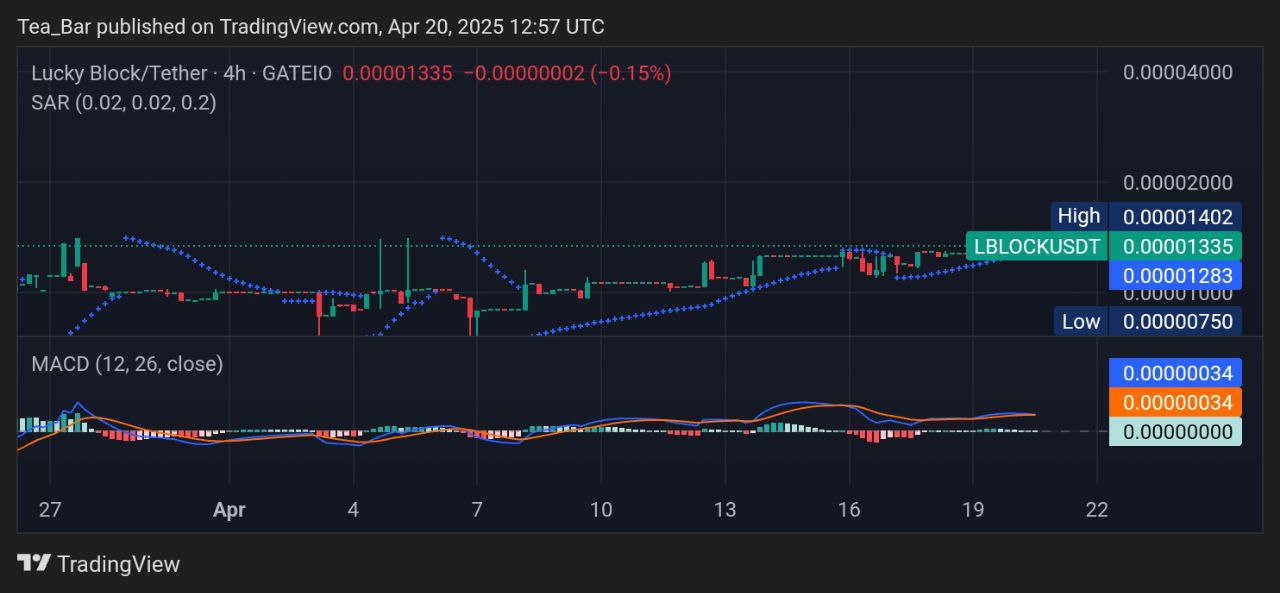
On the 4-hour chart, LBLOCK trades at 0.00001335 USDT, holding above the 0.00001283 support level. The Parabolic SAR dots remain below the price, reinforcing short-term bullish dominance. While the MACD histogram is still negative, its bearish momentum is fading rapidly—a classic sign of an impending reversal. A decisive close above 0.00001402 would confirm bullish intent, potentially triggering a rally toward 0.00002000. The rebound from April’s low of 0.00000750 further highlights strong buyer interest, positioning Lucky Block for upward traction.
Future Outlook: Pathway to New Highs
Lucky Block’s technical alignment suggests a roadmap to recovery. A sustained breakout above 0.00001402 could fuel a 50% surge toward 0.00002000, with the ATH of 0.00004253 acting as a longer-term aspirational target. Traders should monitor MACD crossovers and SAR positioning for confirmation of bullish momentum. With its history of parabolic rallies and a current undervalued status, LBLOCK remains a high-potential asset for investors seeking exposure to tokens with explosive upside.
Invest wisely, and let Lucky Block’s potential work in your favor. You can purchase Lucky Block here. Buy LBLOCK.