Fantom (FTM/USD) Bearish Momentum Quickly Loses Steam
Estimated Reading Time: 3 minutes
Don’t invest unless you’re prepared to lose all the money you invest. This is a high-risk investment and you are unlikely to be protected if something goes wrong. Take 2 minutes to learn more
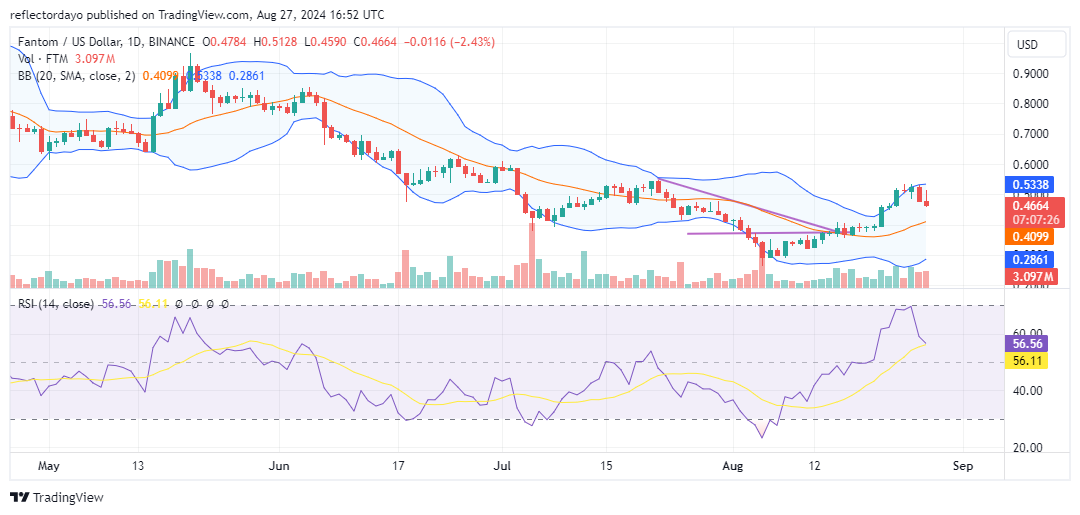
In the middle of the month, the Fantom market reached a critical juncture at the $0.40 price level, following a period of stabilization at the $0.30 support level. After hitting the $0.40 mark, the market consolidated for a time before experiencing a significant breakout, propelling it towards the $0.50 level, which represents the next major price threshold. The bulls managed to push the price close to the recent resistance level of $0.544. However, the bearish presence at this level proved to be strong, resulting in a price rejection.
Fantom Market Data
- FTM/USD Price Now: $0.466
- FTM/USD Market Cap: $1.3 billion
- FTM/USD Circulating Supply: 2.8 billion
- FTM/USD Total Supply: 3.2 billion
- FTM/USD CoinMarketCap Ranking: #57
Key Levels
- Resistance: $0.50, $0.55, and $0.60.
- Support: $0.35, $0.30, and $0.25.
Fantom Market Analysis: The Indicators’ Point of View
After the bullish price was rejected at $0.544, bearish price action was counteracted at the $0.50 level, significantly slowing the bear market and trapping it within a bullish bias around $0.50. Although the Bollinger Bands still indicate an upward-facing price channel, the bearish momentum triggered at $0.544 remains noticeable but, at least for now, is contained above the moving average, which is currently around $0.41. Today’s candlestick is a shooting star, suggesting that the bears are gaining renewed strength and may drive the market further downward. However, when a shooting star appears after a major bearish candle, as may be the case here, it could also indicate that the market is preparing for an upward reversal. In either scenario, investors should closely monitor the crypto signal of next daily session. If the Fantom price continues to push downward towards the 20-day moving average, it would indicate that the bears have prevailed.
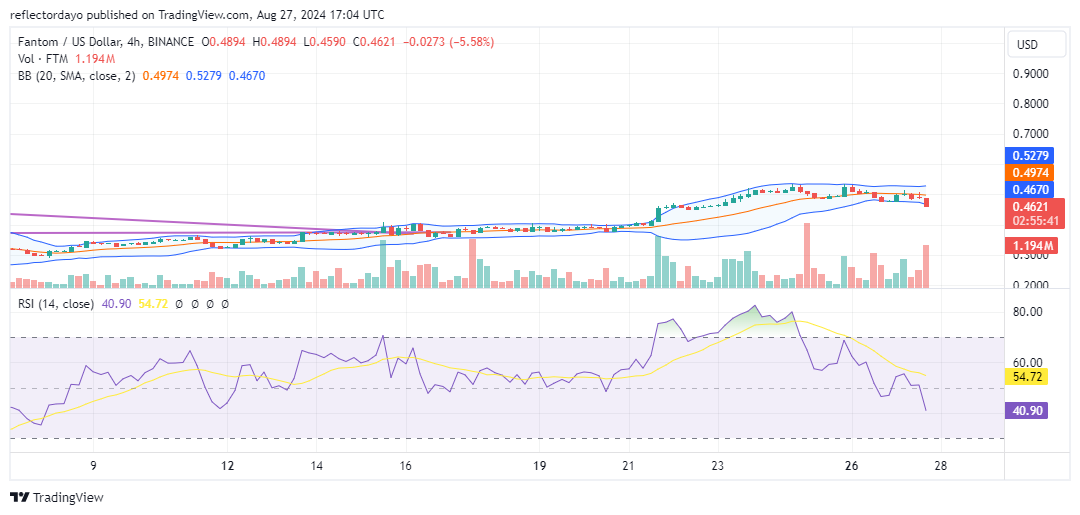
FTM/USD 4-Hour Chart Outlook
The 4-hour chart reveals that both bulls and bears initially struggled around the $0.50 price level. However, upon closer examination, it becomes evident that the price action has predominantly been moving below the horizontally aligned 20-day moving average, indicating an underlying bearish advantage. In the current 4-hour trading session, there are signs of a breakdown in price action, as the bears appear to be gaining control over the bulls. Additionally, the trading volume supports the likelihood that this downward movement is not a fakeout. Nonetheless, traders should carefully monitor the next trading session to gain further insights into market direction.