Livepeer (LPT/USD) Breaks Above $15, Next Stop $16
Estimated Reading Time: 2 minutes
Don’t invest unless you’re prepared to lose all the money you invest. This is a high-risk investment and you are unlikely to be protected if something goes wrong. Take 2 minutes to learn more
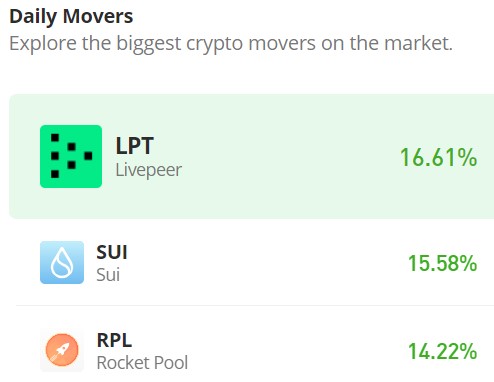
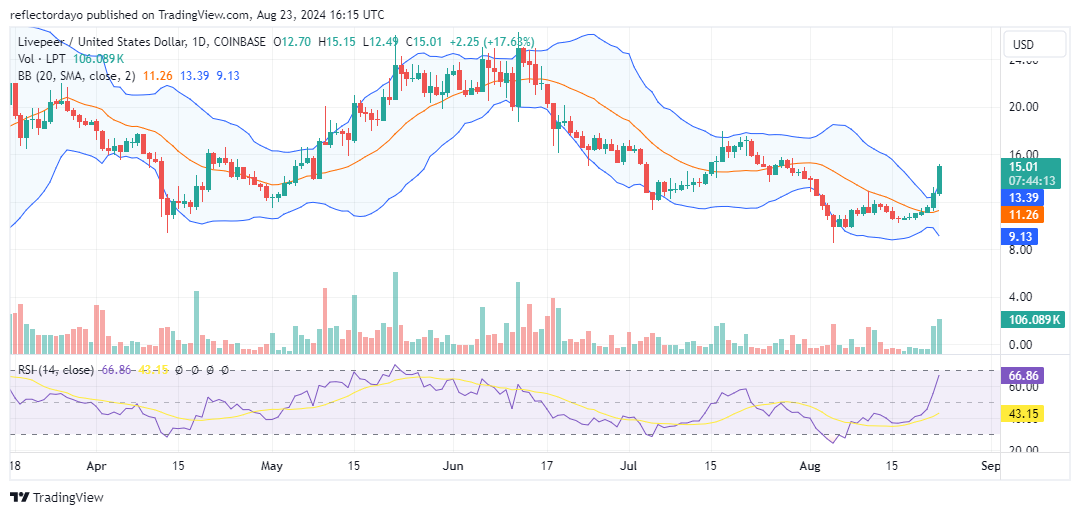
The Livepeer market is experiencing a bullish recovery, having found support at the $10.00 price level. After a period of price stagnation on August 16, the market began a strong upward surge. A significant milestone was achieved when the market rallied above the $12.00 price level, reclaiming it as a support level. The price action is currently approaching the $16.00 price level.
Livepeer Market Data
- LPT/USD Price Now: $15.00
- LPT/USD Market Cap: $511 million
- LPT/USD Circulating Supply: 34 million LPT
- LPT/USD Total Supply: 34 million LPT
- LPT/USD CoinMarketCap Ranking: #131
Key Levels
- Resistance: $16.00, $17.00, and $18.00.
- Support: $12.00, $11.25, and $10.00.
Price Analysis for Livepeer: The Indicators’ Point of View
The bullish momentum has been particularly strong since yesterday’s trading session. The volume indicator histograms support the Livepeer market action, indicating aggressive buying activity. This has crypto signal led to a significant price surge and the market is poised to achieve a second milestone: reclaiming the $16.00 price level. Breaking above this level would signal further bullish potential. However, the vertical surge of the Relative Strength Index (RSI) line suggests hyperbullish sentiment, which could potentially attract bearish pressure. The ongoing bullish trend has caused the Bollinger Bands to diverge, indicating increased volatility and the potential for wider price swings.
LPT/USD 4-Hour Chart Outlook
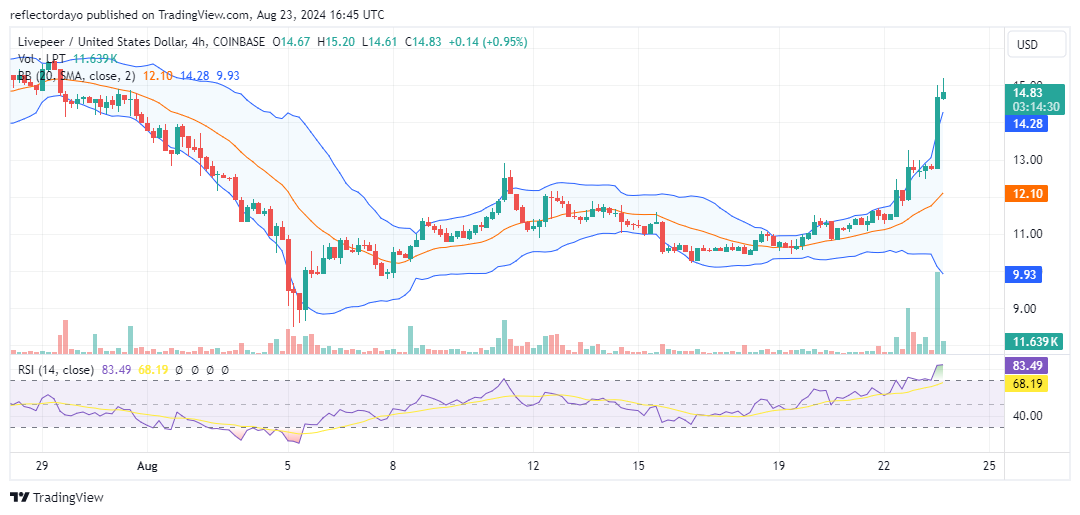
Short-term analysis indicates a potential slowdown in momentum, suggesting that the price may have encountered significant resistance near the $15.00 level. The Relative Strength Index (RSI) is currently hovering around 83, indicating an overbought condition and a potential correction. Given these circumstances, it might be prudent for investors to pause and wait for the formation of a stronger support level before entering the market.