Fetch.ai (FET/USD) Might Be on the Verge of Major Breakout at $1.00
Estimated Reading Time: 3 minutes
Don’t invest unless you’re prepared to lose all the money you invest. This is a high-risk investment and you are unlikely to be protected if something goes wrong. Take 2 minutes to learn more
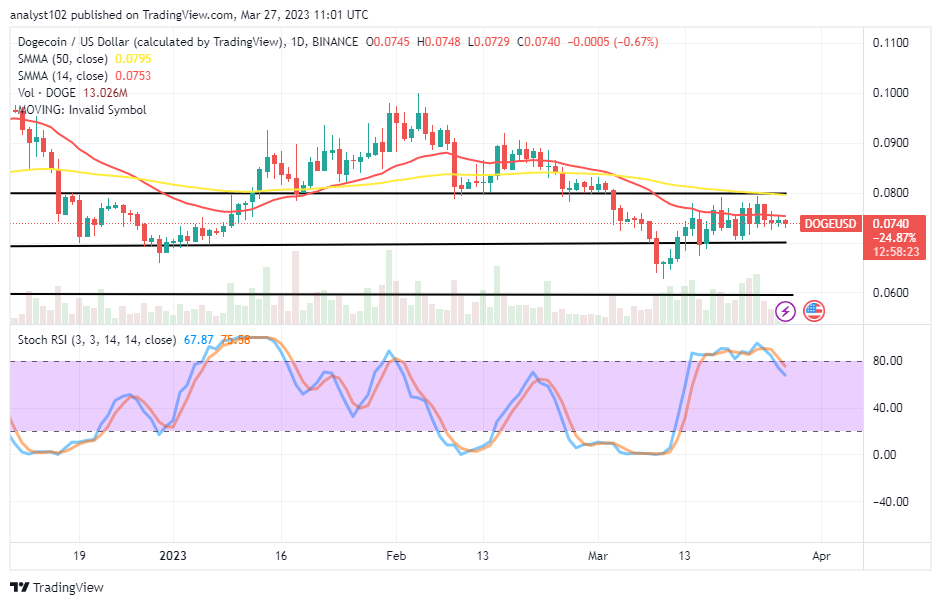
Fetch.ai‘s recent price surge appears to be a corrective response to the prior bearish trend that began near the $1.60 level around mid-July. This bullish crypto signal recovery initiated at a low of $0.70, finding support at the $0.80 level that halted the downward momentum.
Lingering bearish pressure caused the price to consolidate around the $0.80 level for a period. However, renewed buying pressure has now broken this consolidation, suggesting a potential upward trend.
Fetch.ai Market Data
- FET/USD Price Now: $1.0245
- FET/USD Market Cap: $ 2.31 billlion
- FET/USD Circulating Supply: 2.52 billion
- FET/USD Total Supply: 746 million
- FET/USD CoinMarketCap Ranking: #31
Key Levels
- Resistance: $1.100, $1.200, and $1.300.
- Support: $0.800, $0.700, and $0.650.
Price Analysis for Fetch.ai: The Indicators’ Point of View
The market has recently broken out of a prolonged consolidation near the $0.80 level. After days of trading within a narrow range, the price decisively breached the $0.90 mark, indicating a significant shift in market sentiment.
The market has now reached a critical juncture at the $1.00 level, where bulls and bears are vying for control. While bulls currently dominate, the upper shadow on today’s candlestick suggests potential bearish resistance near this price.
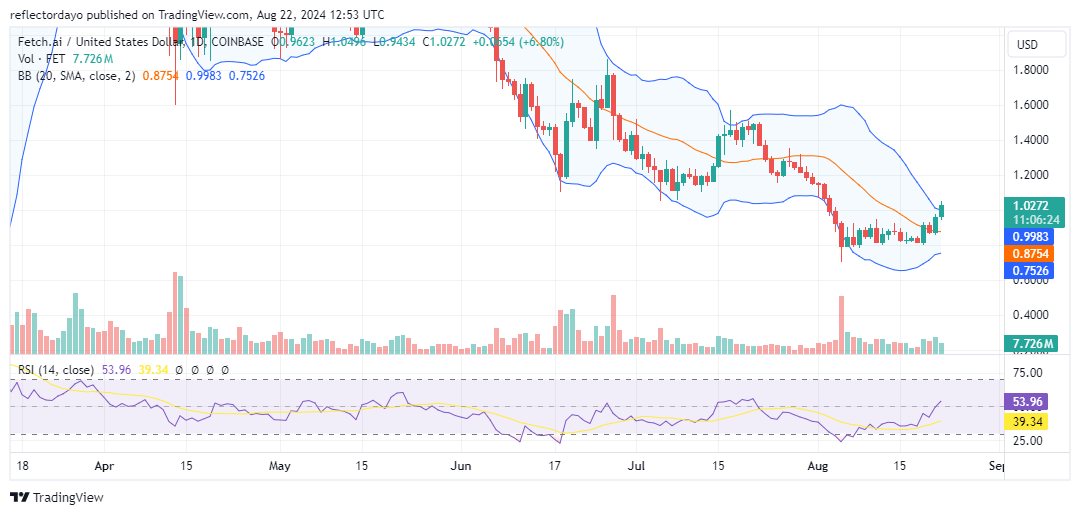
It’s imperative for bulls to maintain dominance at $1.00. Overcoming this resistance would likely force bears to retreat, allowing for a sustained upward movement. Traders should closely monitor the Bollinger Bands indicator. Despite the overall downward trend, the converging lower standard deviation hints at an impending bullish shift.
Although the price is currently near the upper standard deviation, encountering resistance, the formation of a higher support level would bolster the bullish trend. This support would be evident through a period of price consolidation at $1.00.
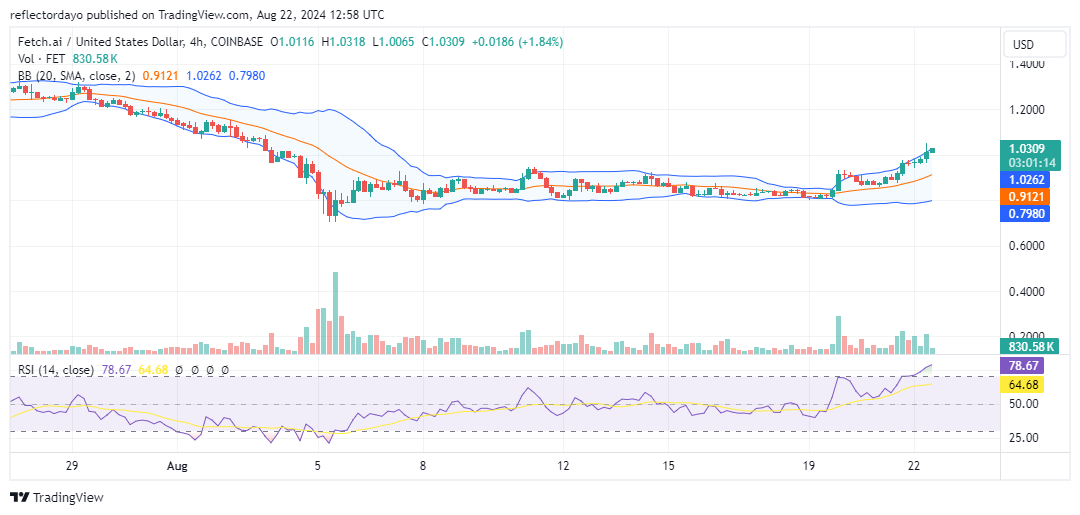
FET/USD 4-Hour Chart Outlook
The 4-hour chart for Fetch.ai suggests a potential peak in the current bullish trend. The recent price surge has encountered a significant resistance level around $1.056, triggering profit-taking and a downward price reversal.
The Bollinger Bands indicator further strengthens this possibility. With a reading of 78, the market is currently highly overbought, indicating limited room for further upward movement in the short term. Selling pressure could become more prominent.
However, if the $1.00 level holds as support, we might see price consolidation before a potential resumption of the uptrend. Consolidation around this level would be a positive sign for continued bullish momentum.