Polygon (MATIC/USD) Rally Gains Momentum, Surging Above $0.5
Estimated Reading Time: 3 minutes
Don’t invest unless you’re prepared to lose all the money you invest. This is a high-risk investment and you are unlikely to be protected if something goes wrong. Take 2 minutes to learn more
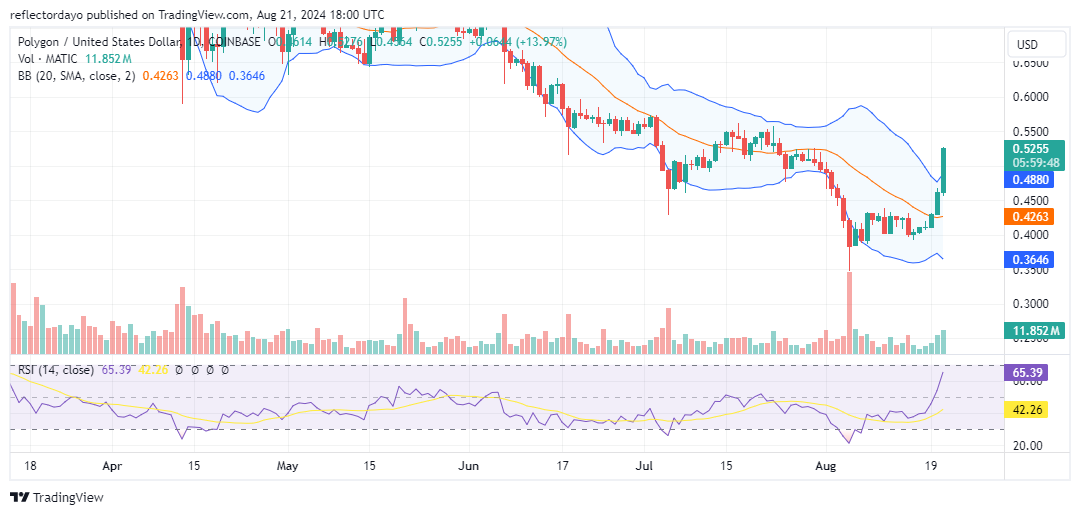
Bullish traders in the Polygon market are now buying aggressively following a significant drop in price action that pushed the market to a low of $0.40. Initially, in July, the market was ranging around the $0.50 level. However, as August began, increasing bearish pressure led to a breakdown in the consolidation trend, driving the price down to $0.40, where a demand level emerged. The price remained at this level for some time, but it is now gaining upward momentum. Bullish activity has driven the market back above $0.50.
Polygon Market Data
- MATIC/USD Price Now: $0.52
- MATIC/USD Market Cap: $5.2 billion
- MATIC/USD Circulating Supply: 9.96 billion MATIC
- MATIC/USD Total Supply: 10 billion MATIC
- MATIC/USD CoinMarketCap Ranking: #19
Key Levels
- Resistance: $0.55, $0.60, and $0.65.
- Support: $0.45, $0.40, and $0.35.
Price Analysis for Polygon: The Indicators’ Point of View
The bullish momentum likely began when the prior aggressive bear market tested and touched the $0.35 price level. Bullish traders started buying the dip at this level, leading to the formation of higher lows. As the lows reached the $0.40 price level, the market entered a period of consolidation, which could be attributed to investors accumulating the asset in anticipation of a breakout—a breakout that has now materialized.
The market now needs to establish support at the $0.50 threshold. According to the Bollinger Bands indicator, the crypto signal is currently showing an overbought condition of the market. However, the Relative Strength Index (RSI) suggests there may still be room for more bullish momentum, though the market is approaching the 70 level, which indicates the overbought region, with the RSI currently at 65. Additionally, the Volume of Trade indicator shows that the ongoing bullish momentum might still have strength, as evidenced by the ascending histograms.
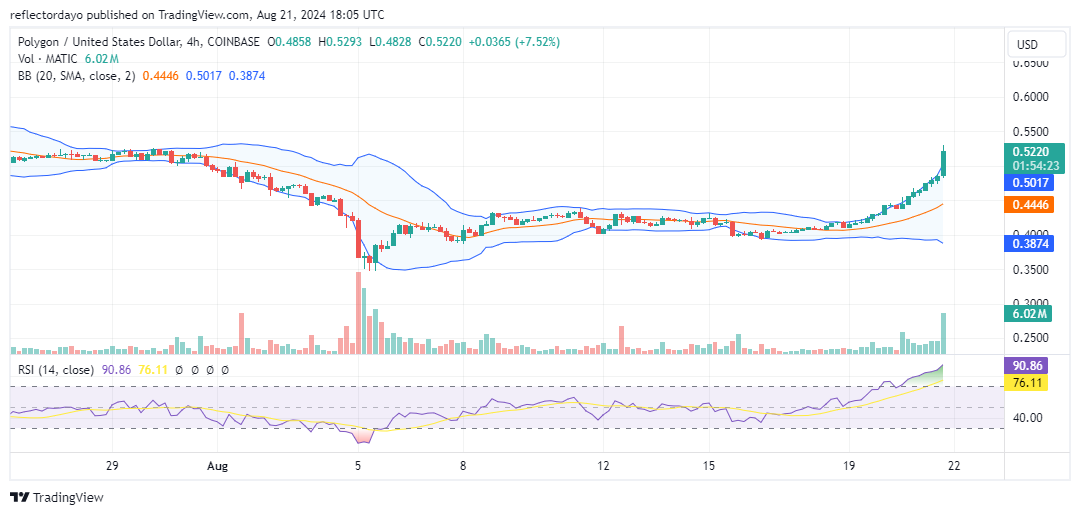
MATIC/USD 4-Hour Chart Outlook
As one would have anticipated, all indicators on the smaller timeframe are showing overbought Polygon market conditions. The RSI has climbed significantly into the overbought region, currently measuring at 91. In light of this, traders should expect a correction, and it may not be prudent to invest at this time. It would be wiser to wait for the price action to establish a higher low, with the $0.50 price level being the most likely support. Despite this, the Volume of Trade indicator continues to support the ongoing bullish momentum. However, the lower standard deviation remains divergent, causing the bands to expand—an indication of increasing volatility. Therefore, despite the positive signal from the Volume of Trade indicator, prices can still change rapidly.