Bitcoin Cash (BCH/USD) Aims to Establish $500 as New Support Level
Estimated Reading Time: 3 minutes
Don’t invest unless you’re prepared to lose all the money you invest. This is a high-risk investment and you are unlikely to be protected if something goes wrong. Take 2 minutes to learn more
Bitcoin Cash is steadily advancing toward reclaiming its late-2023 high of $650. After peaking near $650 last year, BCH underwent a bearish correction, bottoming out at $250 in early April before buyers re-entered the market.
While the recovery has been gradual due to lingering bearish sentiment, recent bullish activity suggests growing momentum. Analysts are now observing increased buying pressure as BCH targets the $500 level—a critical threshold that could solidify as higher support in the crypto signal. A successful hold above $500 may pave the way for a retest of the $650 resistance zone.
Bitcoin Cash Market Data
- BCH/USD Price Now: $493
- BCH/USD Market Cap: $9.7 billion
- BCH/USD Circulating Supply: 19.9 million BCH
- BCH/USD Total Supply: 19.9 million BCH
- BCH/USD CoinMarketCap Ranking: #12
Key Levels
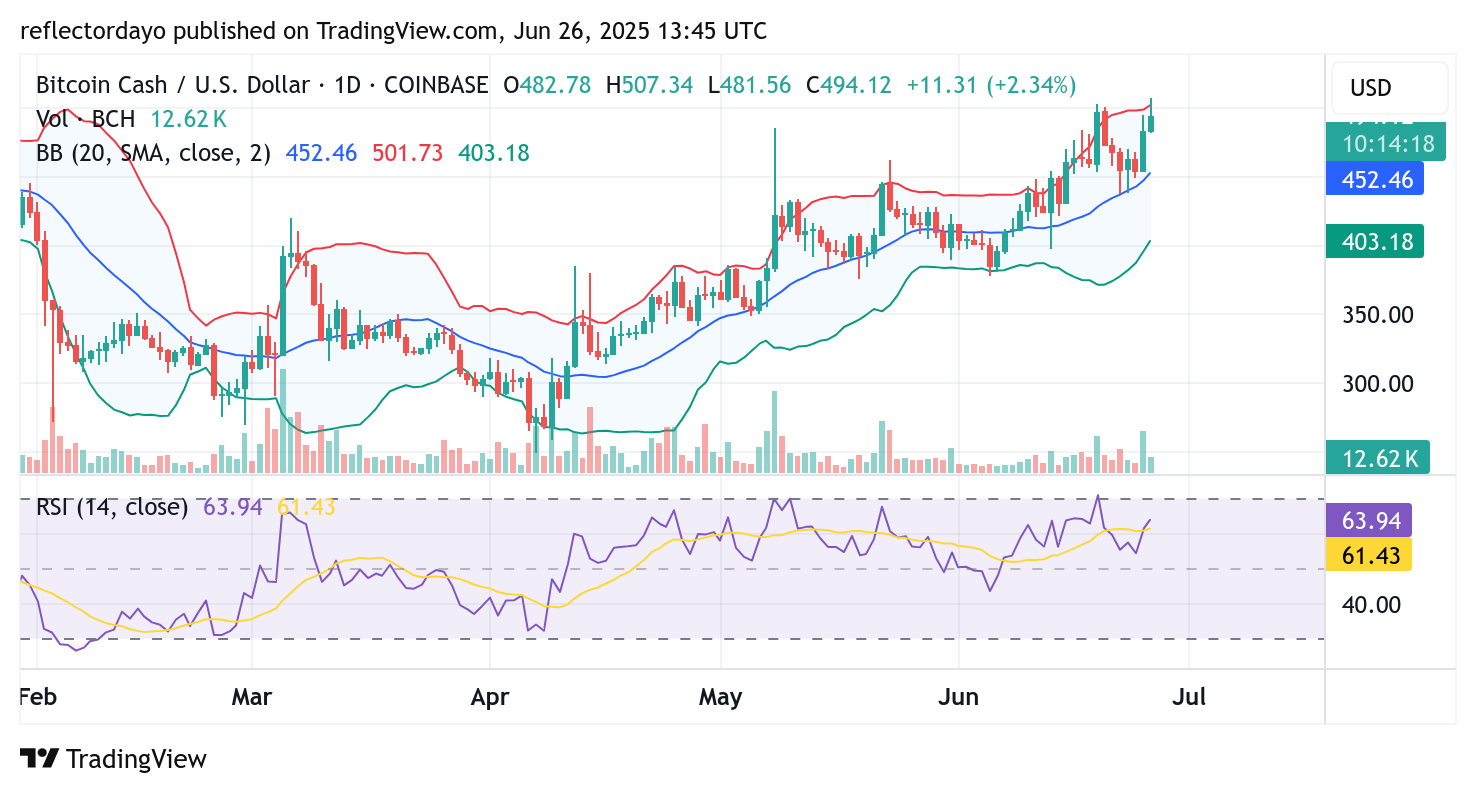
- Resistance: $500, $550, and $600
- Support: $450, $400, and $350
Bitcoin Cash (BCH/USD) Technical Analysis: Bulls Defend $450 Support as Pressure Builds on $500 Resistance
Recent trading sessions show Bitcoin Cash establishing $450 as a new support level following rejection at the key $500 resistance zone. The market’s ability to attract buyers at $450 demonstrates persistent bullish sentiment despite resistance pressure.
While bearish influence remains evident near $500, the formation of reliable support at $450 indicates strong buyer conviction. This price action suggests bulls maintain control of the near-term trend. Should $450 support hold firm, persistent buying pressure could eventually overcome resistance at $500, potentially triggering another upward leg in BCH’s recovery.
BCH/USD 4-Hour Chart Analysis: Consolidation Emerges Near $500 as Market Seeks Direction
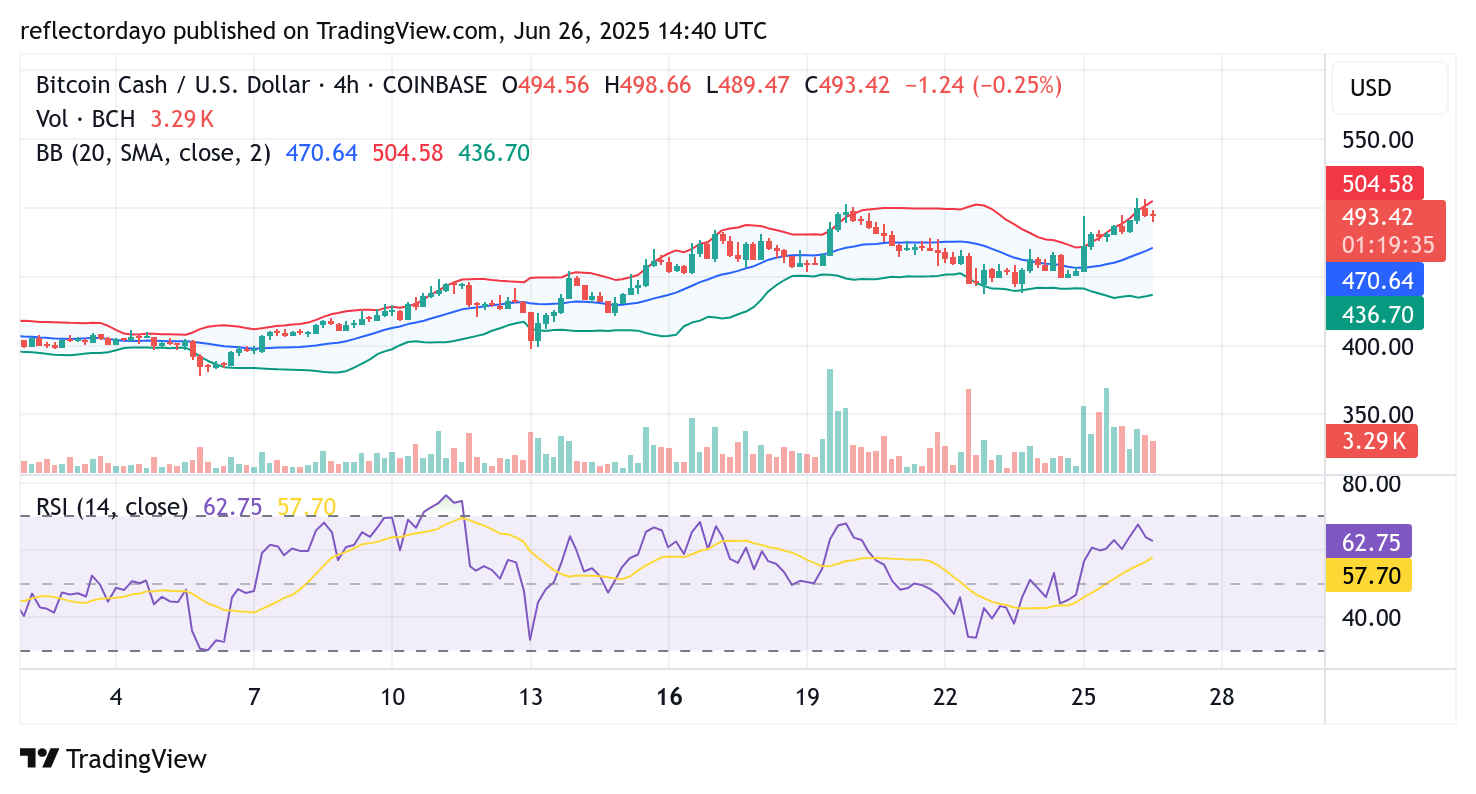
The 4-hour chart reveals a developing consolidation pattern forming around the $500 level, with price action stabilizing slightly below this psychological barrier. Current market conditions show equilibrium between buyers and sellers, resulting in:
- Decreasing trading volume as market participants reach a standoff
- Price stabilization near the $500 pivot point
- Potential for either breakout or correction
This consolidation at recent highs typically precedes either continuation or reversal. Key levels to watch:
- Support zone: $490 (immediate) followed by $450 (stronger)
- Resistance: Firm $500 ceiling
A breakdown below $490 could trigger a pullback toward the $450 support level, while sustained holding above $490 might signal accumulation before another test of resistance. Traders should monitor volume patterns for confirmation of the next directional move, as the current equilibrium between bulls and bears suggests impending volatility.
The narrowing price range and declining volume indicate an approaching resolution to this consolidation phase, with the $490-$500 range serving as the critical decision point for BCH’s near-term trajectory.